

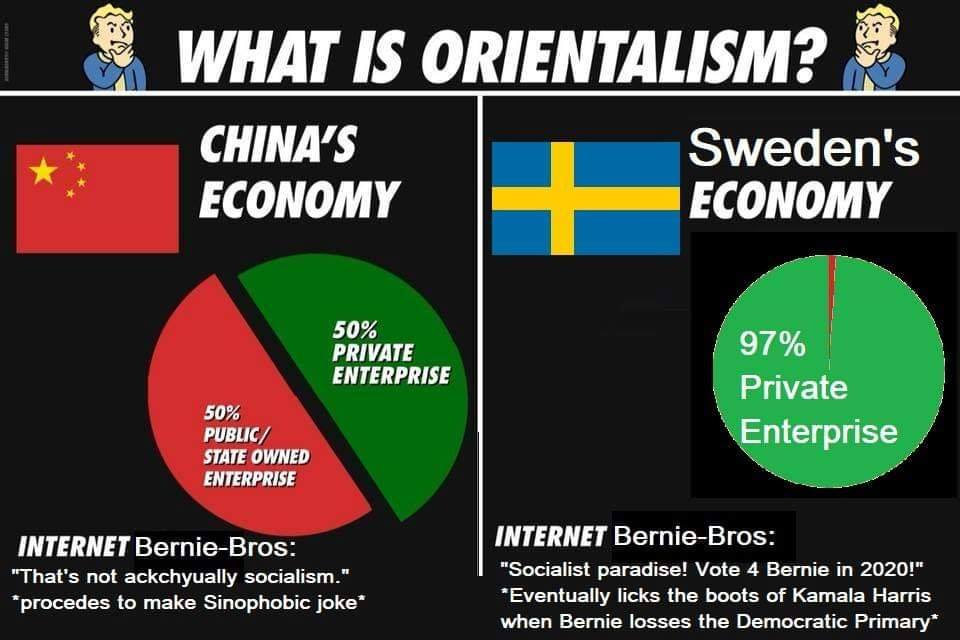
What is that 3% supposed to represent? From some brief poking around, Sweden’s public sector GDP is around 25% of total GDP, while China’s is around 16%. I know it’s a little bit of an apples-to-oranges comparison because the economies are structured differently, but this graph needs a lot more explanation.
Not sure where you “poked around”, but here’s what wikipedia has to say:
Furthermore, much of the private sector in China consists of cooperative ownership. For example, 15.5% of framers worked in cooperatives in 2014. Some of the biggest companies, like Huawei are also cooperatively owned.
Socialism means worker ownership of the enterprise, this includes both state owned and cooperatively owned enterprise. That’s what what half of China’s GDP looks like.
Sure, China wasn’t the oddity. I’m more raising an eyebrow at Sweden’s figures.
Your comment literally states that Sweden has higher public sector GDP than China.
Hmmm, yeah. So I’m trying to figure out how exactly that gets calculated. The figure came from World Bank figures, which appear to not include state owned enterprises. That’s because there’s no one measurement of what “government GDP” is. That’s where this becomes an apples-to-oranges comparison. Sweden’s economy is just different in structure. But I still maintain that 3% is way too low for Sweden.
3% might be too low for Sweden, but it is pretty clear that vast majority of Swedish core economy is privately owned. So even if the joke is overstating private ownership, the gist of it is entirely on point.