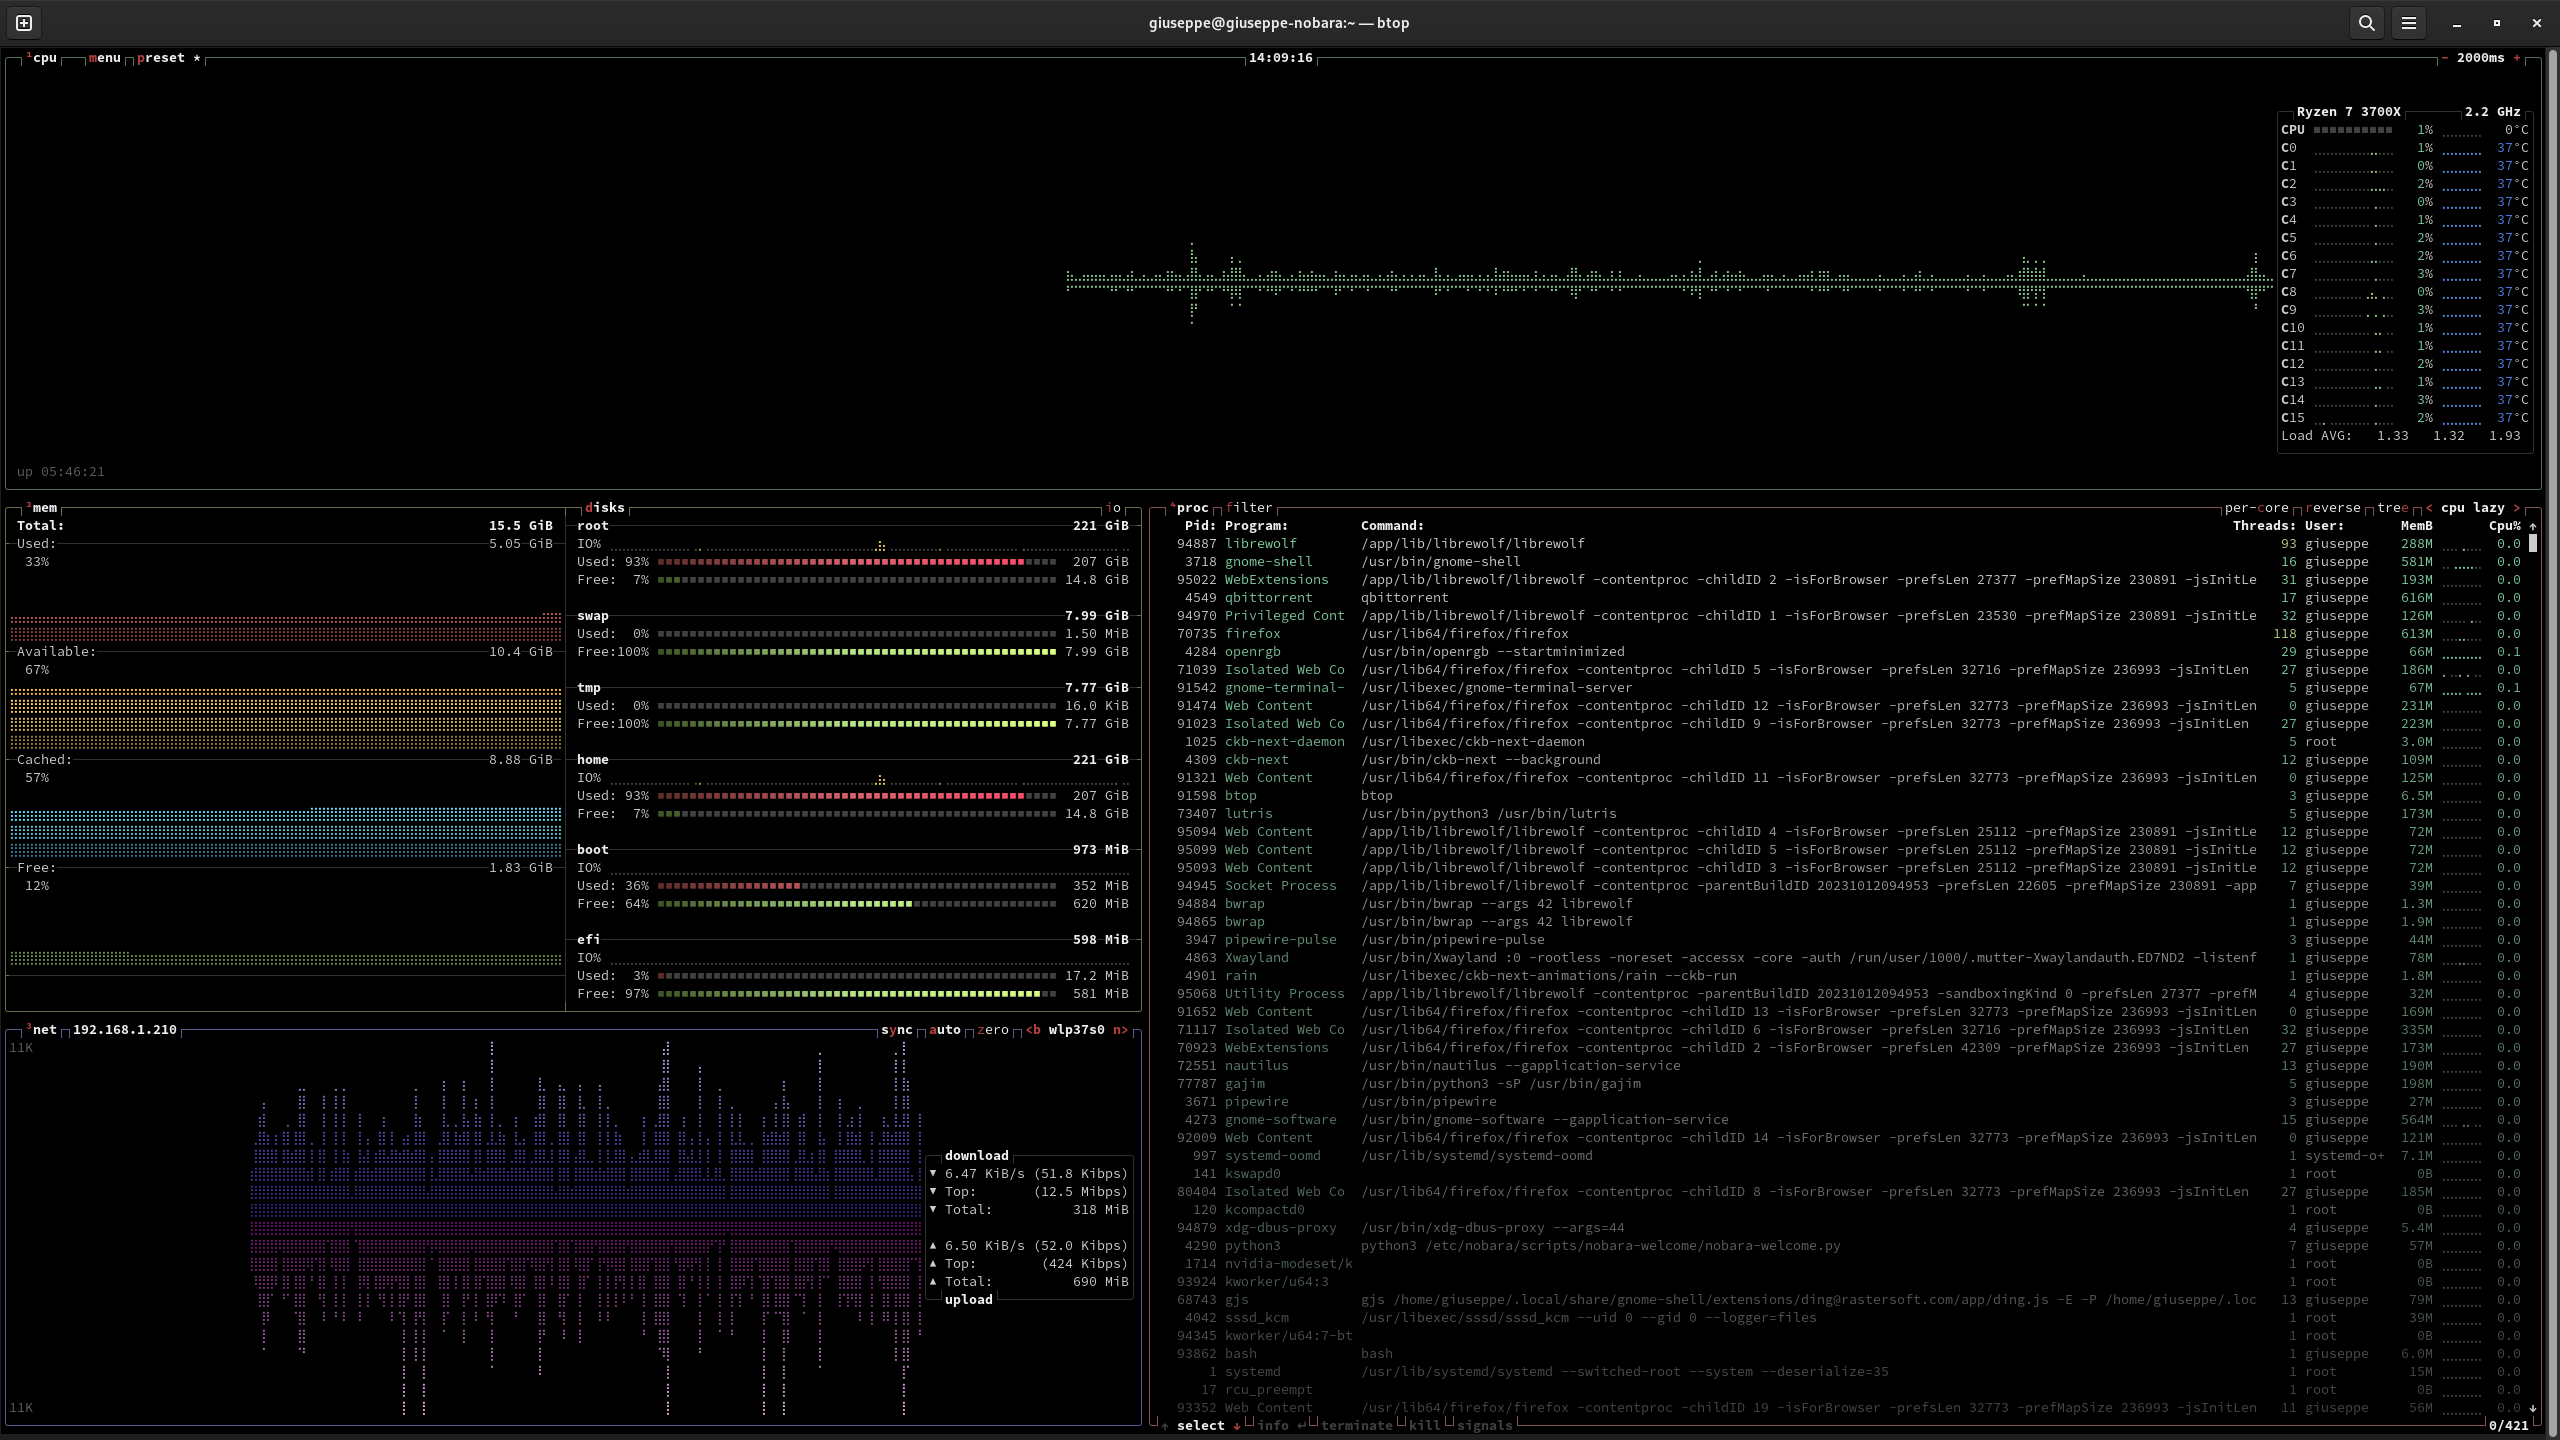
That basically looks like every hollywood movie in existence
Nope, for that use this one, which is also in Debian-based distros and Docker
Clearly OP Is hacking the Matrix.
Ooh, it looks even better than gtop.
Edit: Why does the menu look like this?

50/50 on if it starts listing processes or launches a new game of Zelda.
Say no more, I’m sold
Btop has been rewritten in C++, hence the ++
Uh oh, time to rewrite it in rust
deleted by creator
The rust one is called bottom (btm) see the other thread :). When you already have a rust environment it is just at a cargo install away which is convenient.
Nostalgia city…
Jeez, never saw that, mine just open the program
Pro tip: configure a font that doesn’t show open circles for unused braille characters to have a higher priority than your current font to get better-looking graphs.
On my system, braille characters are provided by DejaVu Serif, and it was as easy as just installing the font.
Where do you see open circles? I don’t understand sorry
I think they mean the variable width of the graph’s columns. If you watch it as the graph moves, there are gaps at every 2 columns.
I don’t understand though the thing about font priorities.
And also, would that just change all fonts? Unless you mod the font to only have the braille characters…No, you’ve got it set up right. Many people will have graphs where each character rectangle has open circles for the unused braile dots in the character block.
Stop has a block mode, I just use that. Stop is so fancy I love it
Does noone use glances anymore?
I do.
One I started using Bpytop, I couldn’t go back.
Removed by mod
Both are useless toys for newbie sysadmins who think their job is sitting and looking at list of processes.
Nice gatekeeping.
Teach me how to know which process is hogging my memory or CPU, in less than 5 steps without htop?
Launch top? Quick glance, type ‘q’, then kill
Lol, top. Try that to figure out the load on a 256 core DGX slurm setup with that shit. Top is barely usable on consumer hardware…
Just type
kto kill.
I mean, you do sometimes need to check out which processes are running to debug
Aren’t
toporpgrepenough for that?If it looks better and does the same thing efficiently, I’ll take the thing that looks better.
You have a pre-installed tool and a tool that looks better but which you need to install. When you need it for a rare task, and you administer many machines, it is easier to use what you already have on each of them.
Do these programs not work over SSH?
Sorry, I don’t understand what you are talking about. Yes, you can run them in SSH session. No, you still need to have them installed on the remote machine to do this. And installing diagnostic tools is not only time consuming, sometimes it can be even impossible if you already get in troubles (and if you did not, why would you need them?).
Hmm, that’s a fair argument. I’m pretty sure new server installations can just have their default program list modified though.
It is, for them.
I ditched all top programs on my system, because I have no use for any of them…
How do you check what is eating up all your memory/cpu?
Just download more, simple.
⬆️ This man is too dangerous to be left alive.
mount google drive as swap. RAM downloaded !!
I kinda want someone to make this for shits and giggles.
https://blog.horner.tj/how-to-kinda-download-more-ram/
Already been done.
My computer just works so I’ve never needed to check, but I run XFCE & have xfce4-taskmanager installed, so I could use that if I ever needed…
Ah, I see. I use htop as a task manager.
To get a comprehensive overview of your system’s resource usage, install and run the
btopcommand. It’s a top-like interactive system monitor that displays a range of system information, including:-CPU usage (per core and overall)
-RAM usage (free, used, and cached)
-Disk usage (per disk and overall)
-Network usage (bytes sent and received)
-Process list (with CPU, RAM, and disk usage per process)
-System temperature
-Uptime
I only use htop to kill process when it froze.
I just use xkill for that…
A question, what tod do when the laptop is completely frozen, as in you can’t even move your mouse. Is the only solution to force shutdown?
You can try the Magic SysRq key, if its enabled.
Thankfully I’ve never had that happen, but if it did I would probably just switch to a tty & use the killall command on whatever was giving me bother…
Yeah, that looks very cool. Wish I could use it as my wallpaper or a widget in gnome
Open btop in the terminal, then (note the terminal window must not be in fullscreen) right click with the mouse on the top bar of the terminal window and select “Always on top”.
I’m using lcdproc on a 20x4 characters display, it’s enough to see cpu, load, mem, Network, etc
Show us
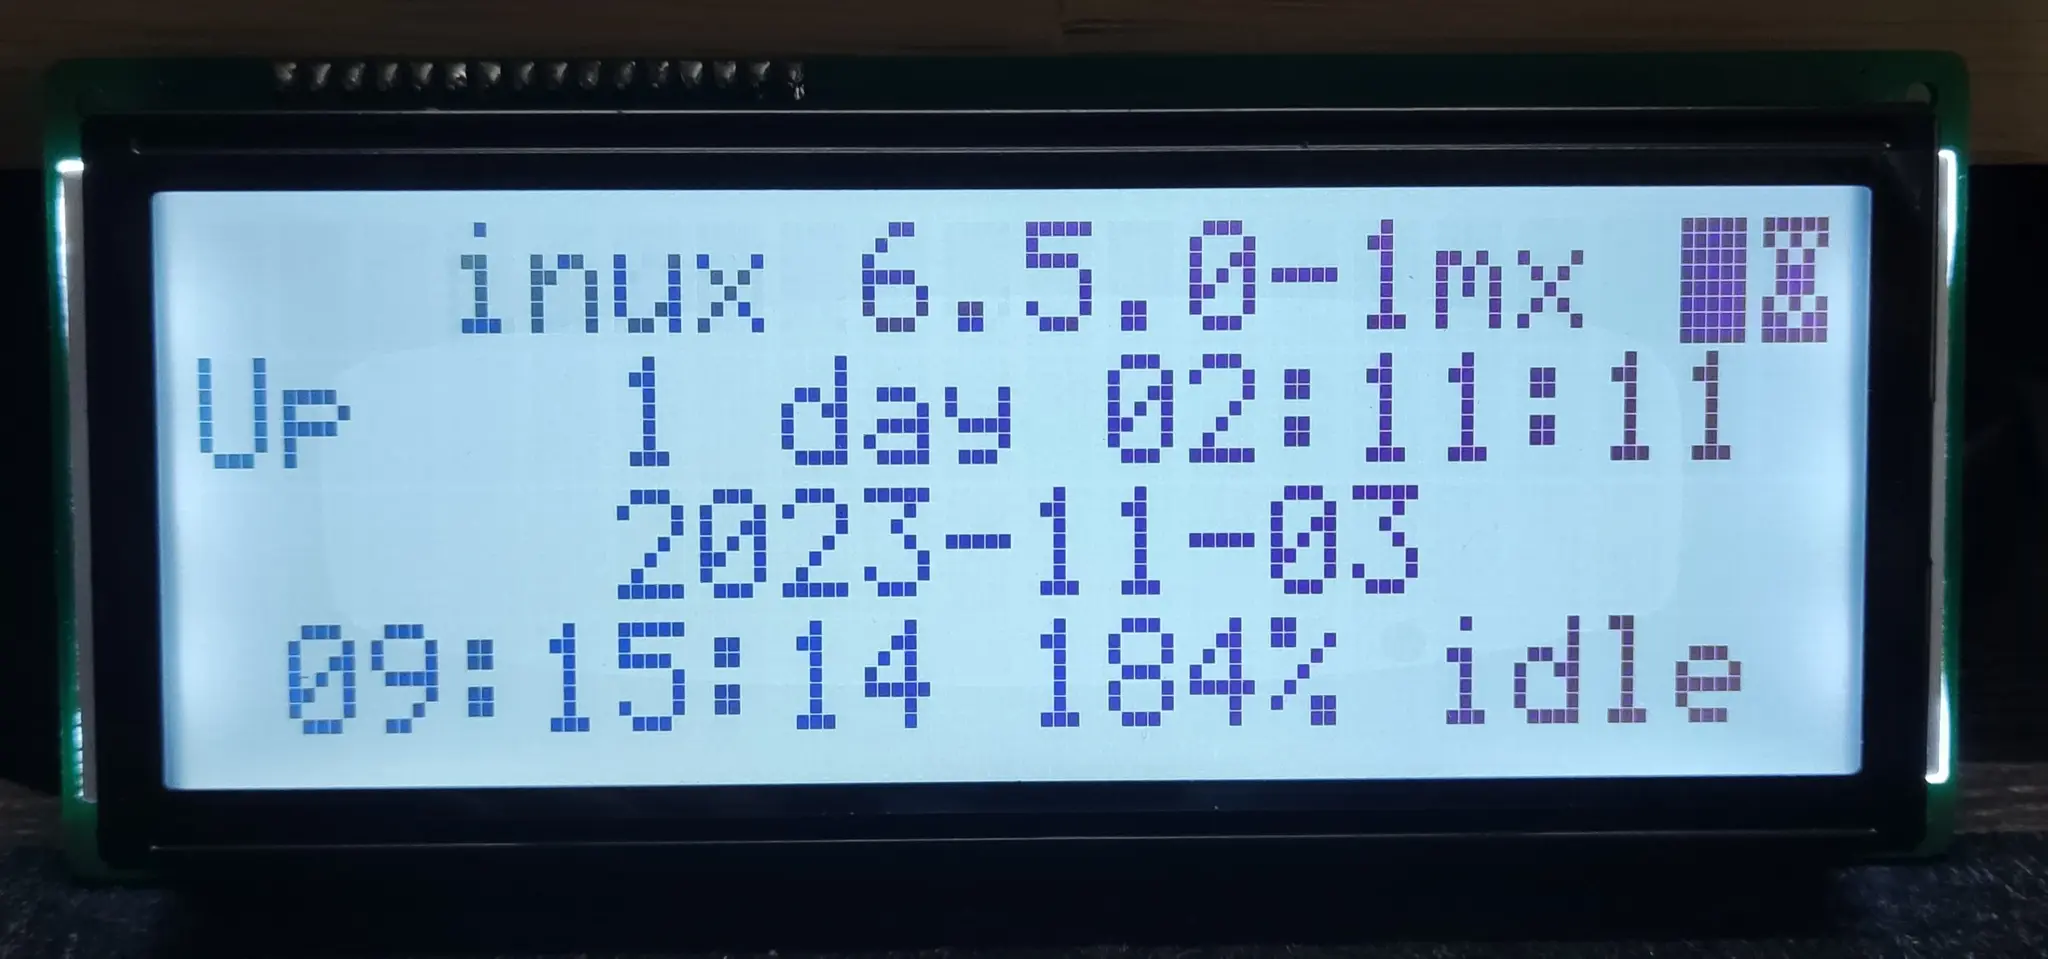
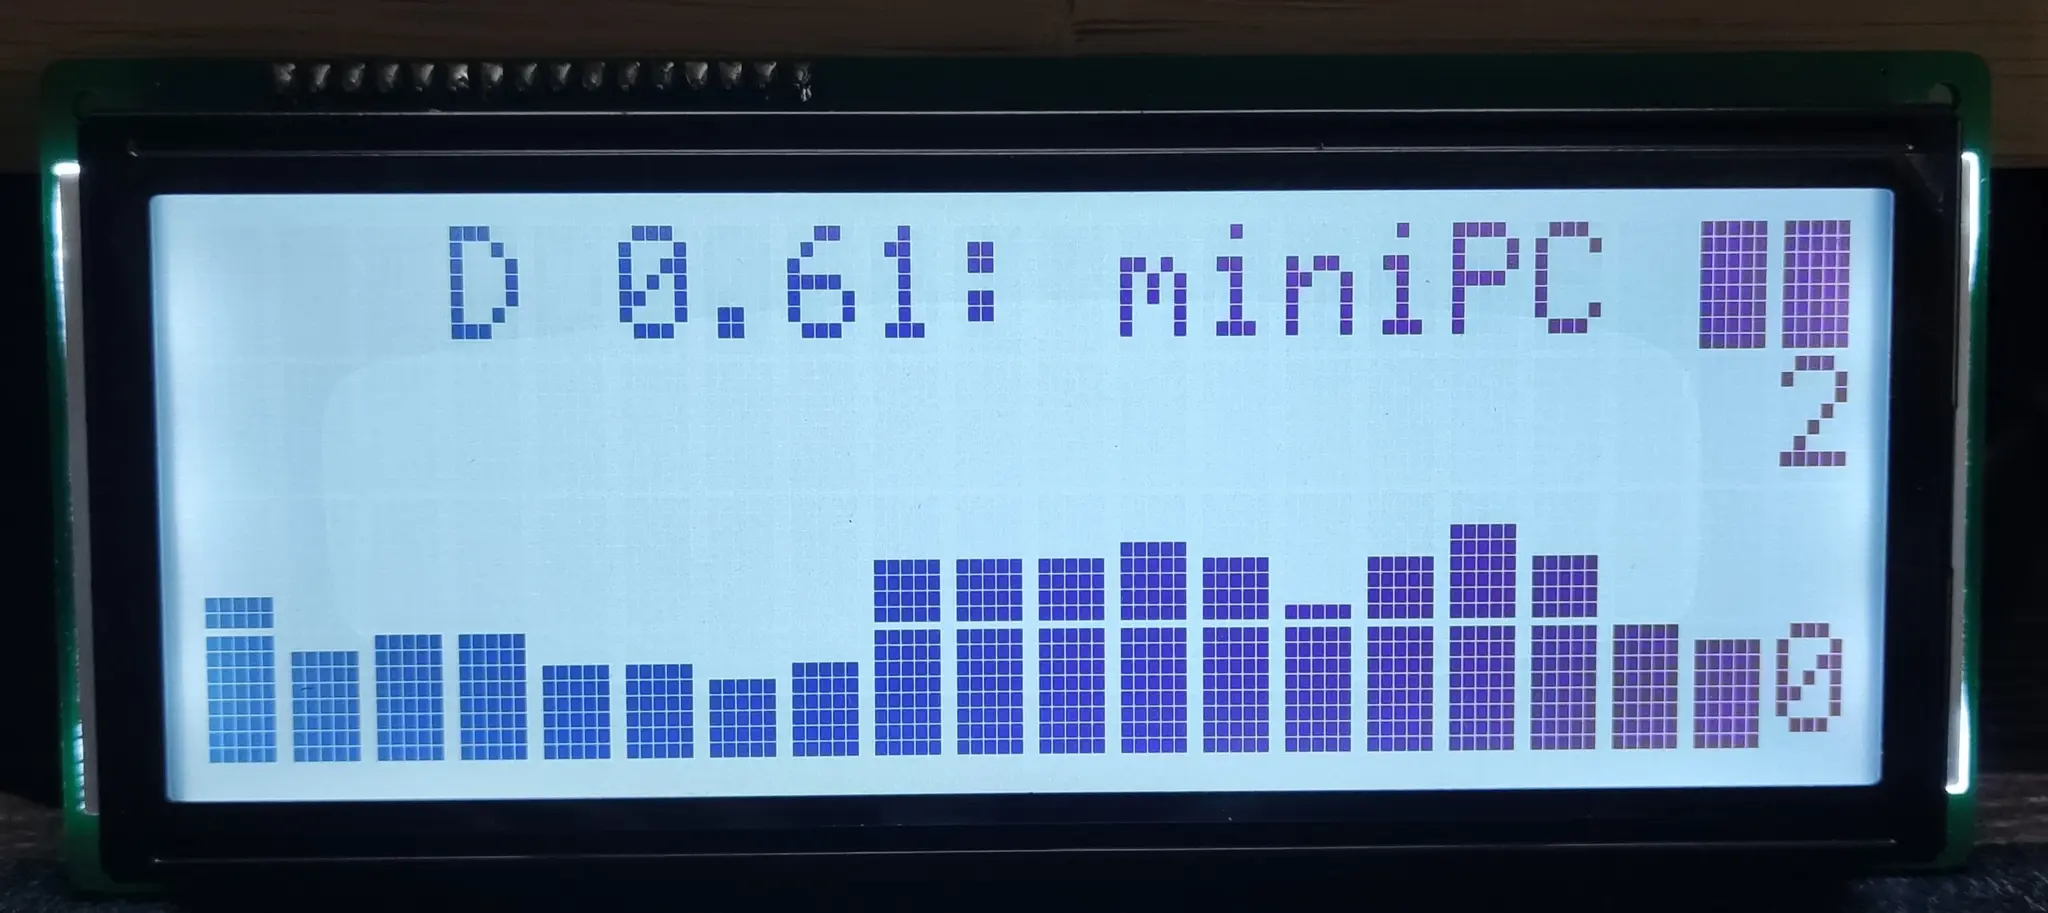
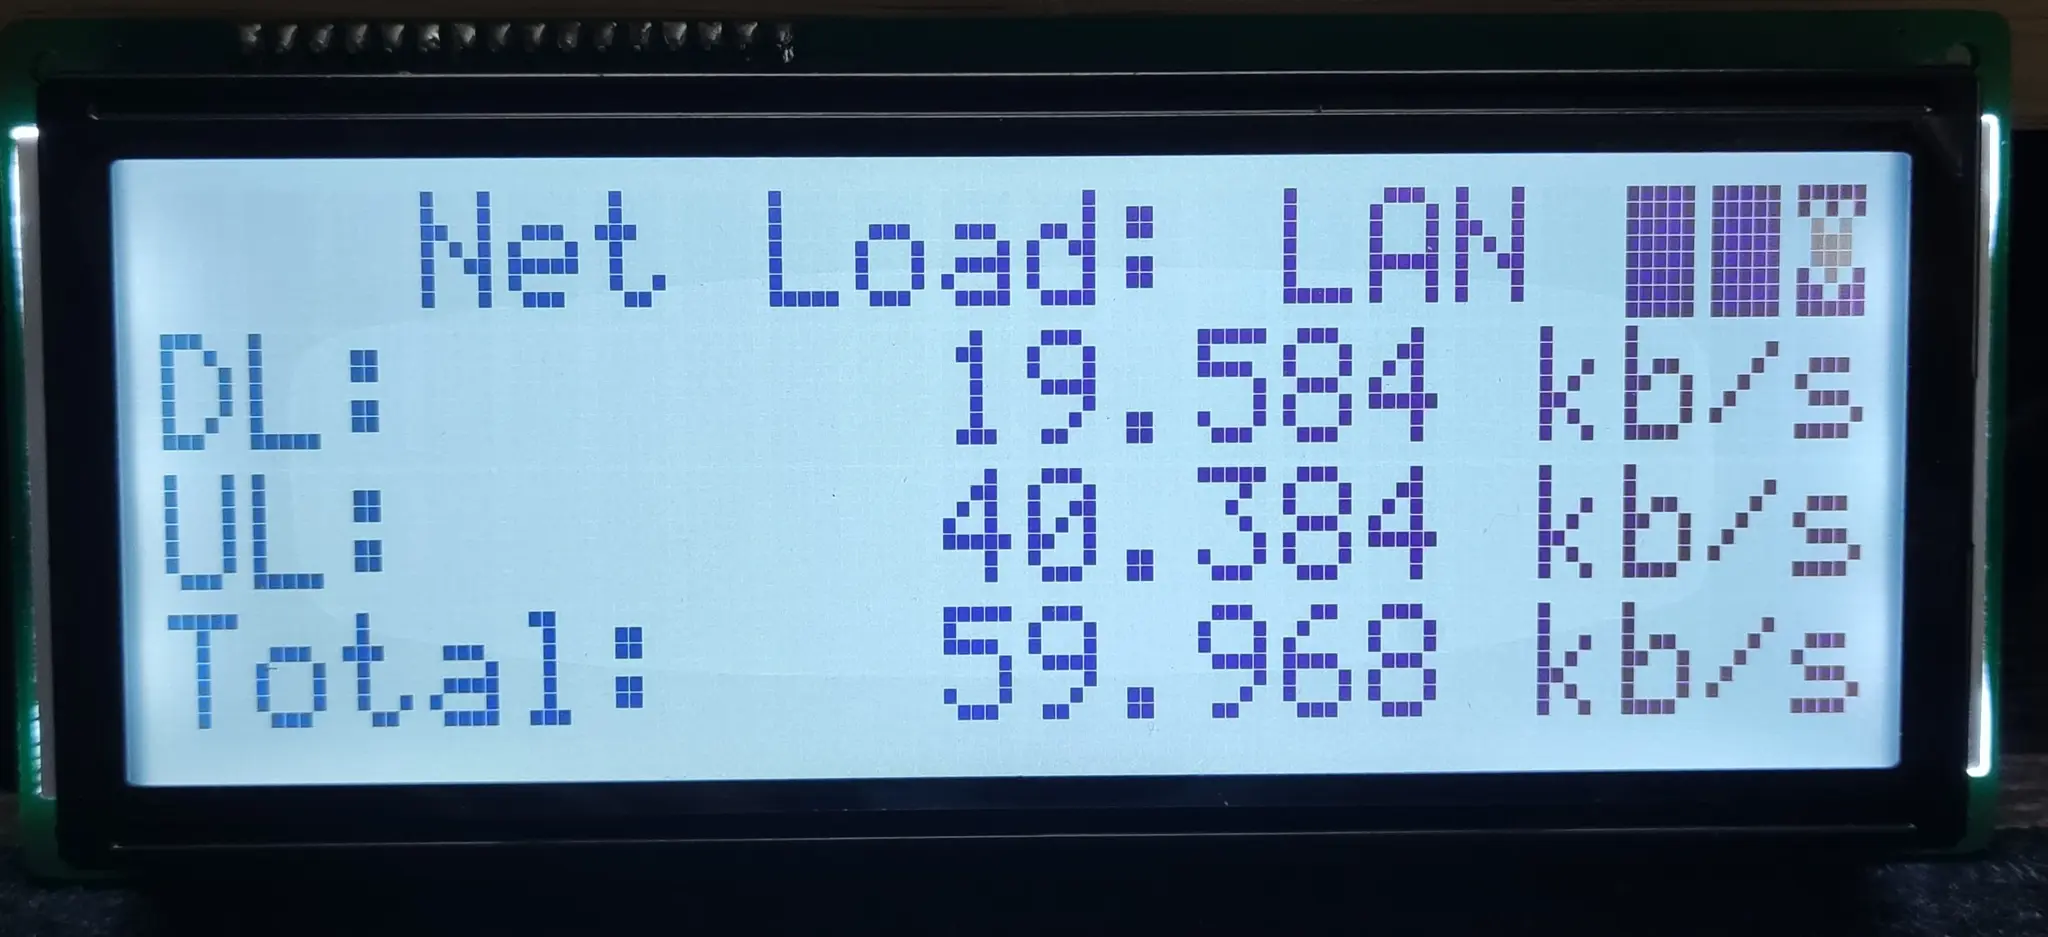
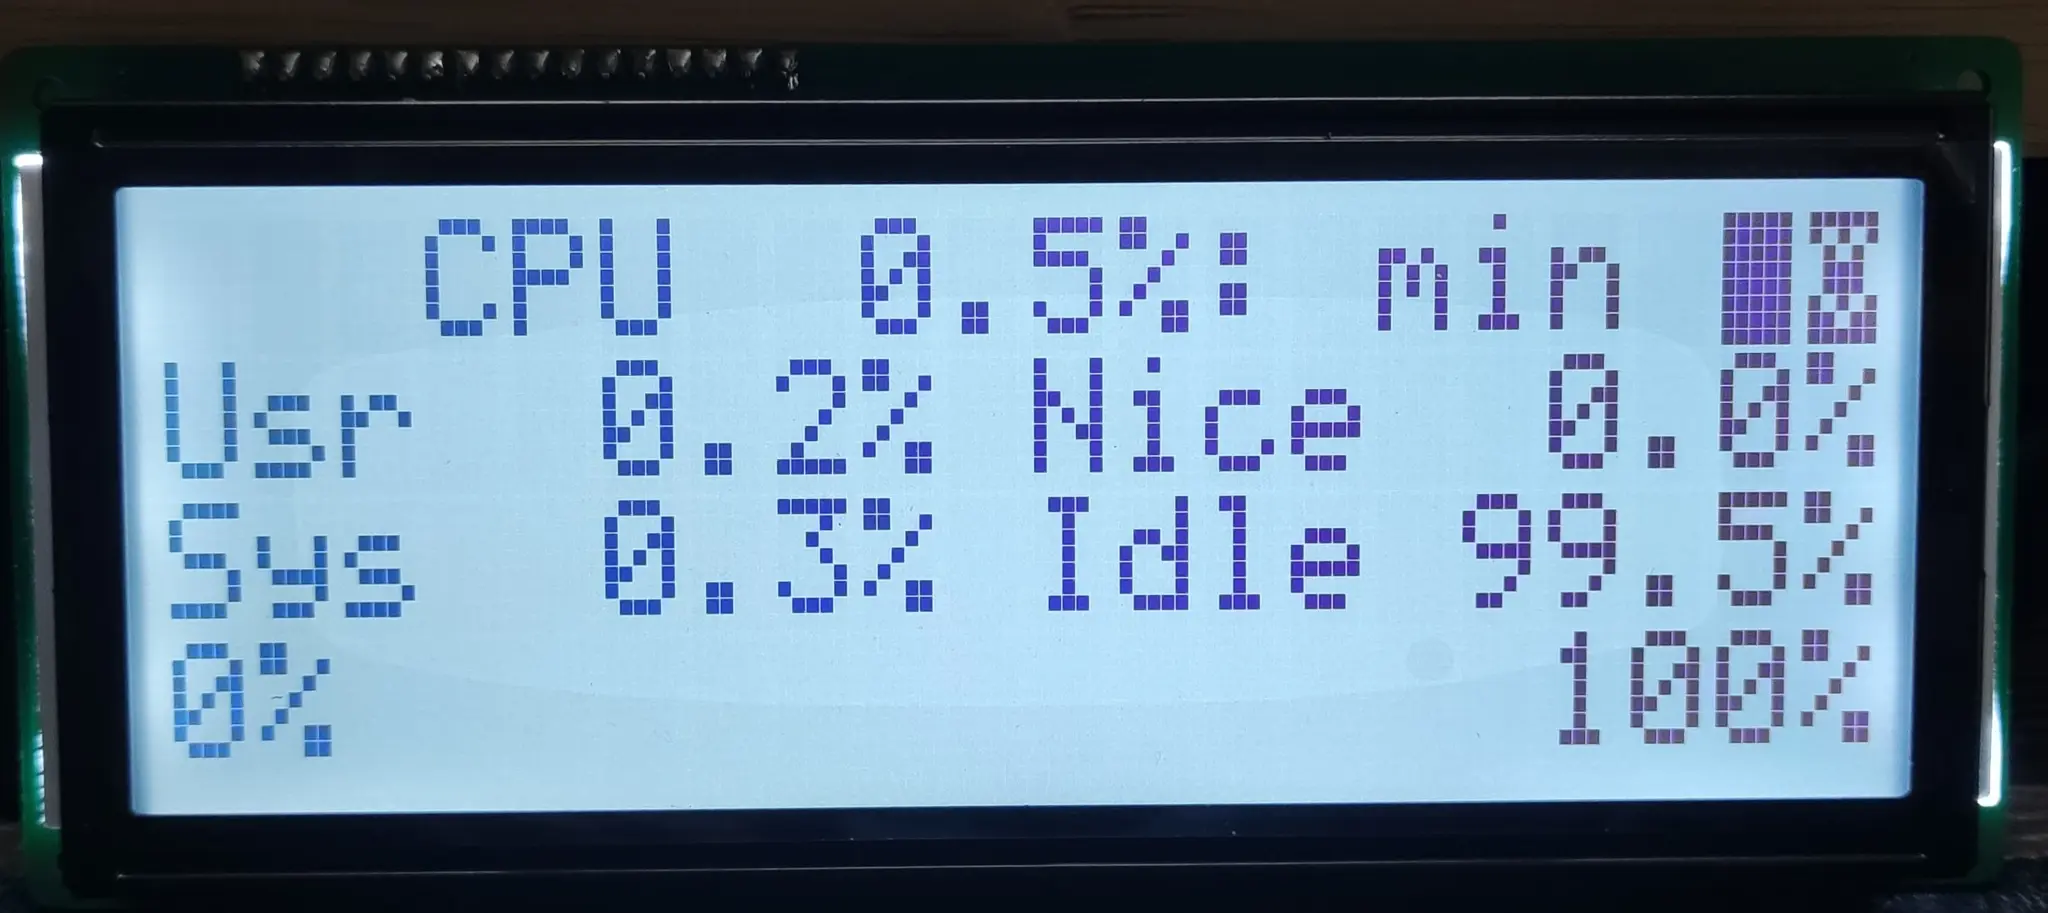
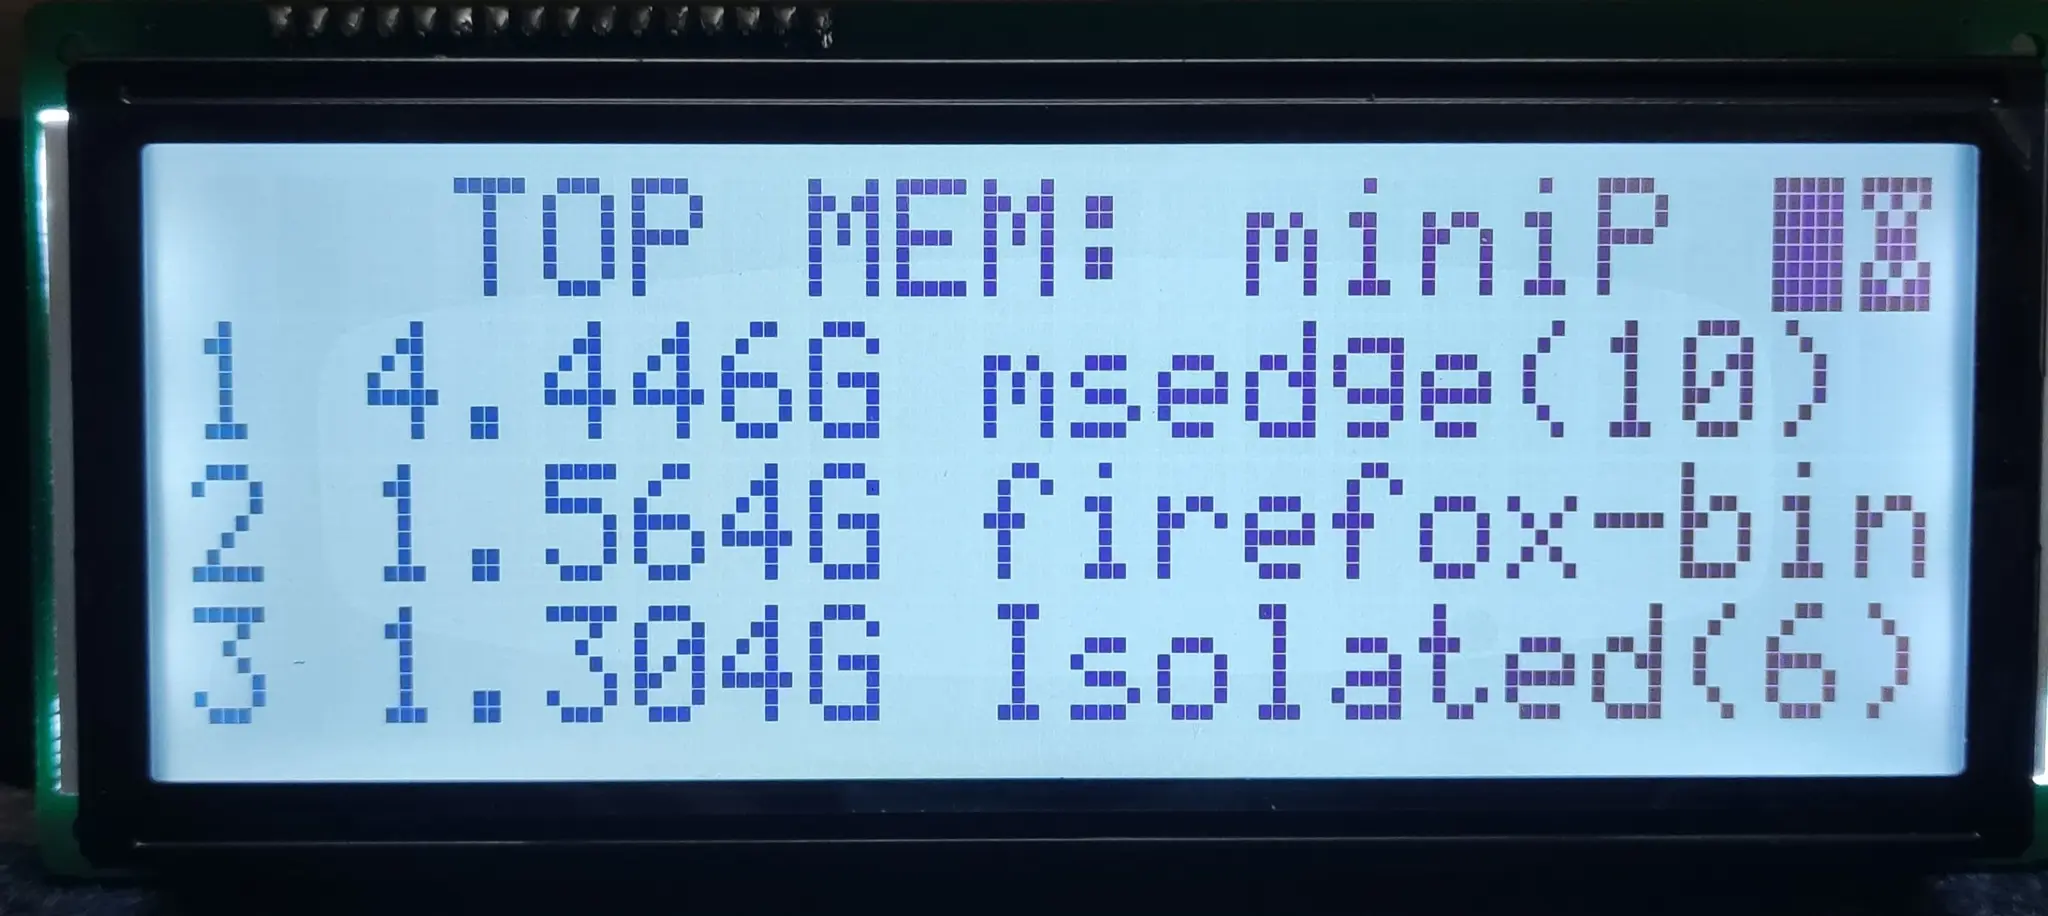
Very nice
This looks great! Thanks for the recommendation.
I like Netdata because it’s web based, has a large number of metrics, you can pan/zoom the graphs, and it doesn’t use much CPU power. Console UIs are nice but they’re more limiting than something web-based.
Can it show each core’s frequency? Or is there anything other than htop that can do that?
It does
I don’t see any option in 1.2.13, and https://github.com/aristocratos/btop/issues/190 suggests it isn’t implemented yet.
True, i confused it with clock frequency.
I just wish there was a .deb package.
Still gonna get around to making a playbook for installing it someday. btop (and it’s predecessors) are awesome.
There’s a deb in Ubuntu Universe.
Oh heck, it’s in Debian Bookworm too, and Bullseye-Backports.
Debs all around.I could have sworn I checked and didn’t find it. I’ll look again, maybe I did something wrong
Purely on aesthetics, I find bashtop nicer, but I couldn’t get it on my server.
I often use glances for general monitoring.It’s very attractive, but it also seems to have a minimum window size requirement that exceeds the “stack” in my “master and stack.”
It’s great to use if you need a dashboard to track issues, but for a quick look at running processes, I think I’ll stick with htop.
has more empty space. Can the user change that?
You can collapse the subwindows and configure the graphs
Oh, good.