- cross-posted to:
- learn_programming@programming.dev


cross-posted from: https://programming.dev/post/6660679
It’s about asking, “how does this algorithm behave when the number of elements is significantly large compared to when the number of elements is orders of magnitude larger?”
Big O notation is useless for smaller sets of data. Sometimes it’s worse than useless, it’s misguiding. This is because Big O is only an estimate of asymptotic behavior. An algorithm that is O(n^2) can be faster than one that’s O(n log n) for smaller sets of data (which contradicts the table below) if the O(n log n) algorithm has significant computational overhead and doesn’t start behaving as estimated by its Big O classification until after that overhead is consumed.
#computerscience
Image Alt Text:
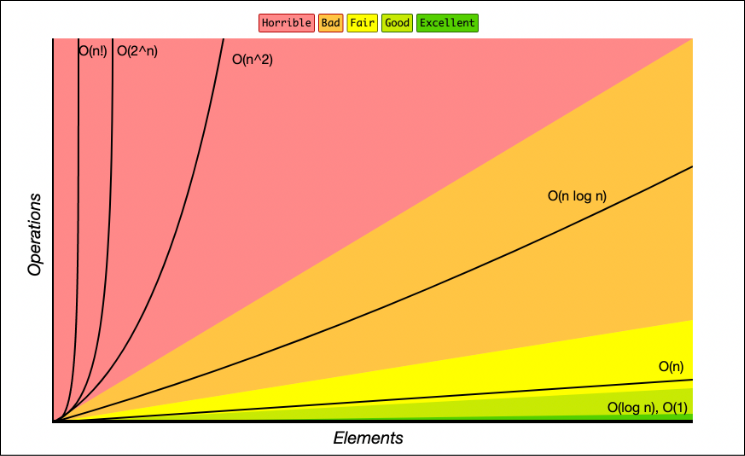
"A graph of Big O notation time complexity functions with Number of Elements on the x-axis and Operations(Time) on the y-axis.
Lines on the graph represent Big O functions which are are overplayed onto color coded regions where colors represent quality from Excellent to Horrible
Functions on the graph:
O(1): constant - Excellent/Best - Green
O(log n): logarithmic - Good/Excellent - Green
O(n): linear time - Fair - Yellow
O(n * log n): log linear - Bad - Orange
O(n^2): quadratic - Horrible - Red
O(n^3): cubic - Horrible (Not shown)
O(2^n): exponential - Horrible - Red
O(n!): factorial - Horrible/Worst - Red"
I mean, it is entirely reasonable that “bad” is the best performance you can hope for while sorting an entire set of generally comparable items.
If you can abuse special knowledge about the data being sorted then you can get better performance with things like radix sort, but in general it just takes a lot of work to compare them all even if you are clever to avoid wasted effort.