Energy efficiency of active travel (walking, cycling, ebike) compared to an electric carslrpnk.netimage silence7 ( @silence7@slrpnk.net ) M Climate - truthful information about climate, related activism and politics.@slrpnk.net • edit-22 months ago message-square63fedilinkarrow-up1239
arrow-up1239imageEnergy efficiency of active travel (walking, cycling, ebike) compared to an electric carslrpnk.net silence7 ( @silence7@slrpnk.net ) M Climate - truthful information about climate, related activism and politics.@slrpnk.net • edit-22 months ago message-square63fedilink
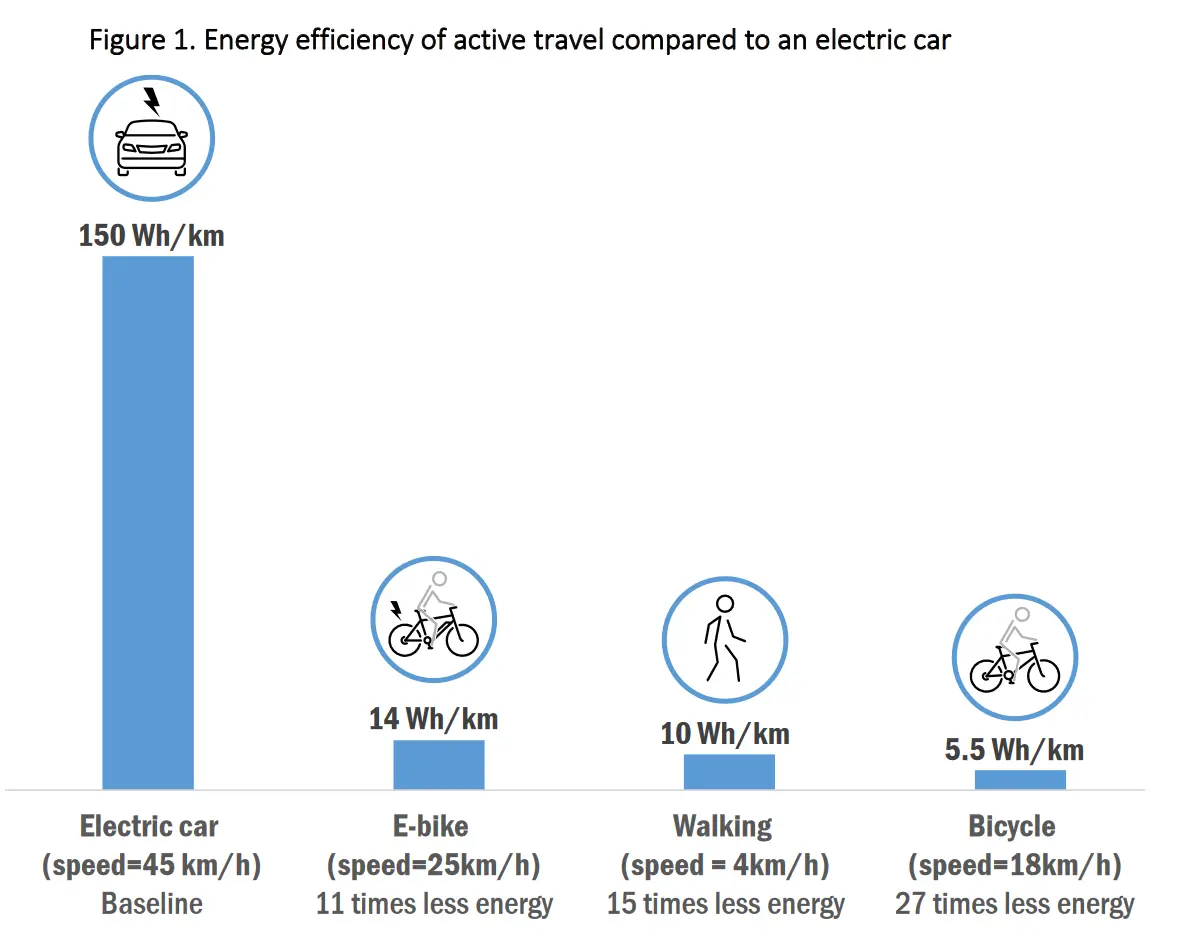
minus-square Sonori ( @sonori@beehaw.org ) linkfedilink2•2 months agoIn this graph a bus would be a lot worse than a far given the massive size, aerodynamic brick wall, and constant stops.
minus-square Ismay ( @Ismay@programming.dev ) linkfedilink4•2 months agoYeah but you have to divide the footprint by the average number of travelers.
minus-square Sonori ( @sonori@beehaw.org ) linkfedilink1•2 months agoWhich in non city environments with high frequency is often only a handful to a dozen at most. Not that it matters, as this graph doesn’t show or or try to compare per person, only calories per vehicle mile.

In this graph a bus would be a lot worse than a far given the massive size, aerodynamic brick wall, and constant stops.
Yeah but you have to divide the footprint by the average number of travelers.
Which in non city environments with high frequency is often only a handful to a dozen at most. Not that it matters, as this graph doesn’t show or or try to compare per person, only calories per vehicle mile.