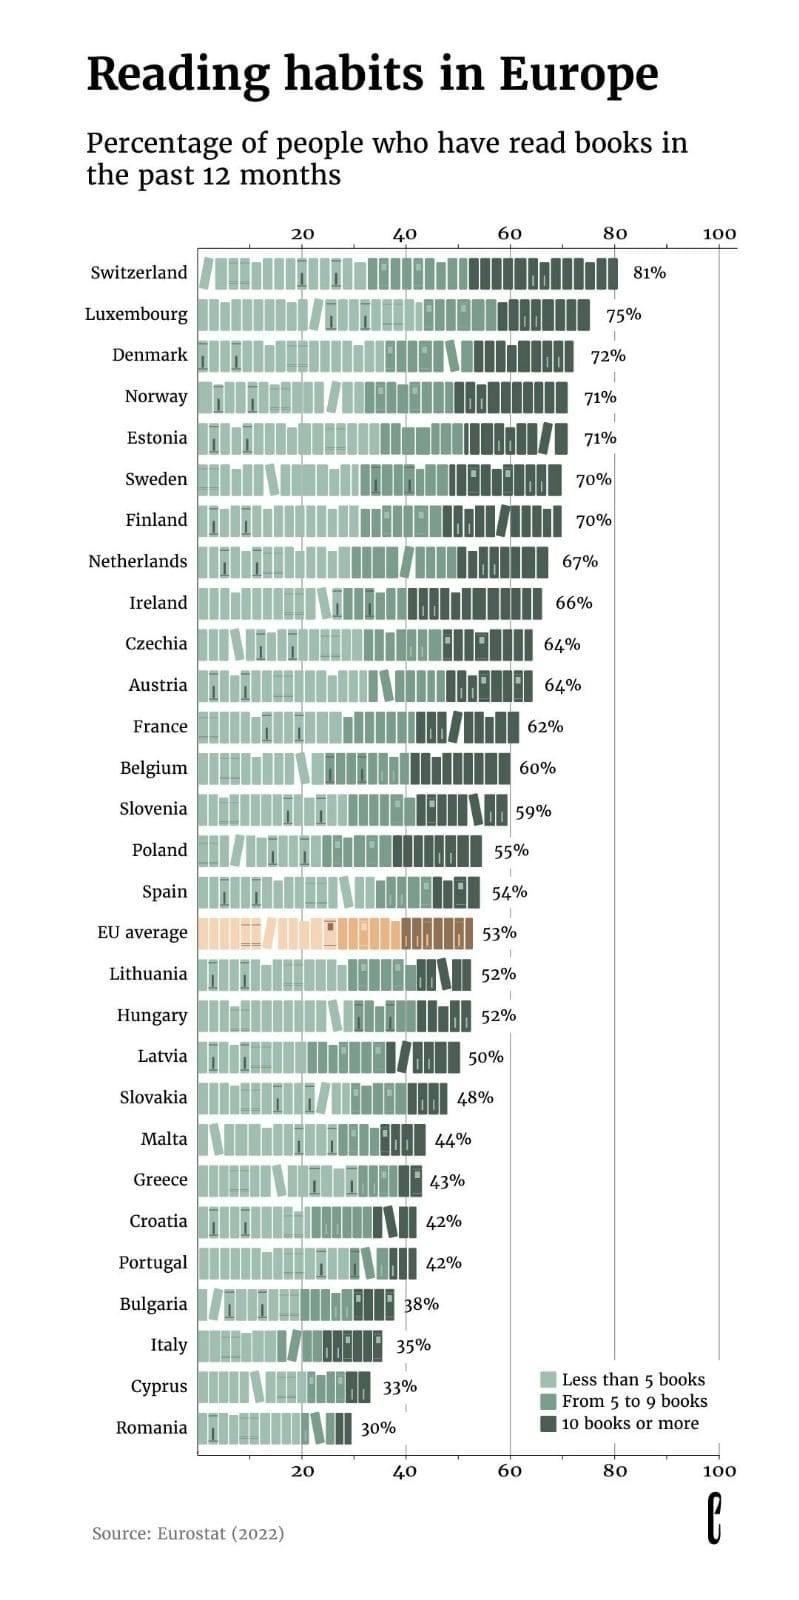
The 0 books category is the empty space in the right side of the graph. The graph is about the percentage of people that read at least a book and then the colours say the different amount of books. Like if from 100 people 1 person read 12 books they would still count as only 1%. Their 1% would have a different colour tho. The people reading 0 books don’t count towards the percentage of people having read a book.


The 0 books category is the empty space in the right side of the graph. The graph is about the percentage of people that read at least a book and then the colours say the different amount of books. Like if from 100 people 1 person read 12 books they would still count as only 1%. Their 1% would have a different colour tho. The people reading 0 books don’t count towards the percentage of people having read a book.