

Look at the education graph, it tells the entire story here. The more likely you are to have gone to uni and learned how to effectively source factual information by yourself, learned how to skim read longer and more complex source material, maybe even learned something of Australian history beyond the whitewashed and over-simplified version in high school, the less likely you were to be influenced by a No campaign that was primarily about spreading as much fear and misinformation on social media as possible.

The mobile booth results from remote Indigenous communities in the NT is also really interesting. The yes vote aligns with the inner city seats, which is not something you’d usually expect to see.
I think the interesting bit about that is not the inner city polling, which leaned Yes (relatively speaking) everywhere, but the fact that the Yes campaign seemingly struggled to appeal to remote Indigenous communities (again, relatively speaking) despite putting a lot of effort into reaching those people. Conversely, the No campaign was mostly run online and through the media - they had only a fraction of the volunteer and on-the-ground support - yet they performed above expectations in those areas.
Didn’t most of the remote Indigenous vote yes? It seems like it was more likely the adjacent non Indigenous communities that voted the other way.
Yes, which was a given. I don’t think those areas performed as well as the Yes23 campaign predicted, however.
Yeah that’s definitely true too. Though those surveys were done way back when the national support was much higher.
This is a great snapshot and breakdown of the result and voting patterns. Really interestingly is the comparison to the last referendum (for a republic). That was almost 25 years ago now - but the electorate results are almost identical.

The way they lined it up based on location (distance from city), age, and income, they made it look like it wouldn’t matter what you were actually going to be voting for, the answer will be No.
Oh boy the libs are not getting those inner city seats back anytime soon.
I’d like an overlay with media diversity data thrown in and analysed as well.
In any case, many want a different approach. I hope that the majority want an approach that is not to continue with the status quo, and to create a strong representation of the indigenous population within our system.
In any case, many want a different approach. I hope that the majority want an approach that is not to continue with the status quo, and to create a strong representation of the indigenous population within our system.
Not going to happen.
The people who voted “no” while pretending the vote didn’t live up to their standards are not going to suddenly start financing and supporting one that does because.
The standard was created with the intention that nothing will ever live up to it.
Wait, what? We actually have some media diversity?
I’m sorry I couldn’t get through that awful scrolling design pattern. Just give me a damn slideshow or something.

I’mma try and copy/paste this into comment or two for shits and giggles. In the meantime if someone could create a website that turns interactive articles into regular articles that would be great.
Beyond No, here’s what we know about the Voice results
By Tim Leslie, Ashley Kyd, Julian Fell, Ben Spraggon and Matt Liddy
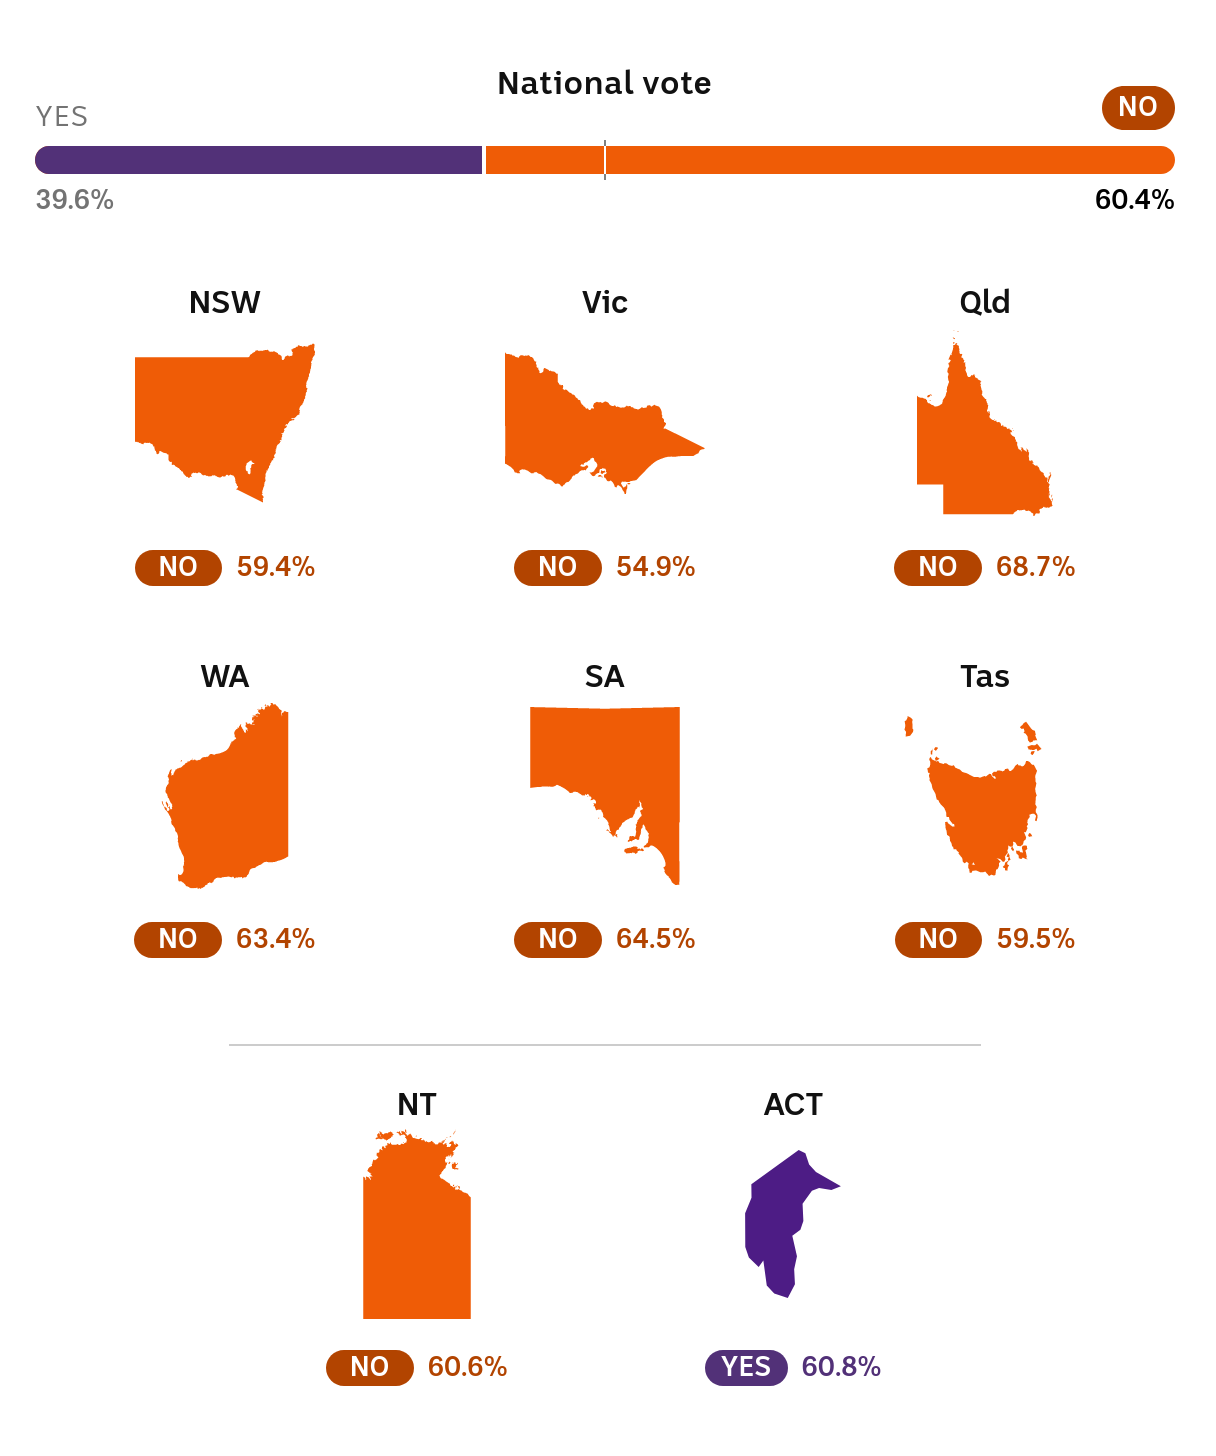
Australians in all six states have said a resounding No to a Voice to Parliament, sinking a years-long campaign for Indigenous constitutional recognition.
For Yes campaigners, the picture is stark.
There’s still more counting to do, but only the ACT will return a vote for Yes.
But these maps alone aren’t enough to tell us the full story of how the country voted.
Let’s dig deeper and see what more we can reveal.
Along the way, we’ll find out what the places with the highest and lowest Yes votes have in common, as well as uncovering just how little might have changed since the republic referendum was held 24 years ago.
First up, we’re going to bring in a map of Australia that looks a little different.
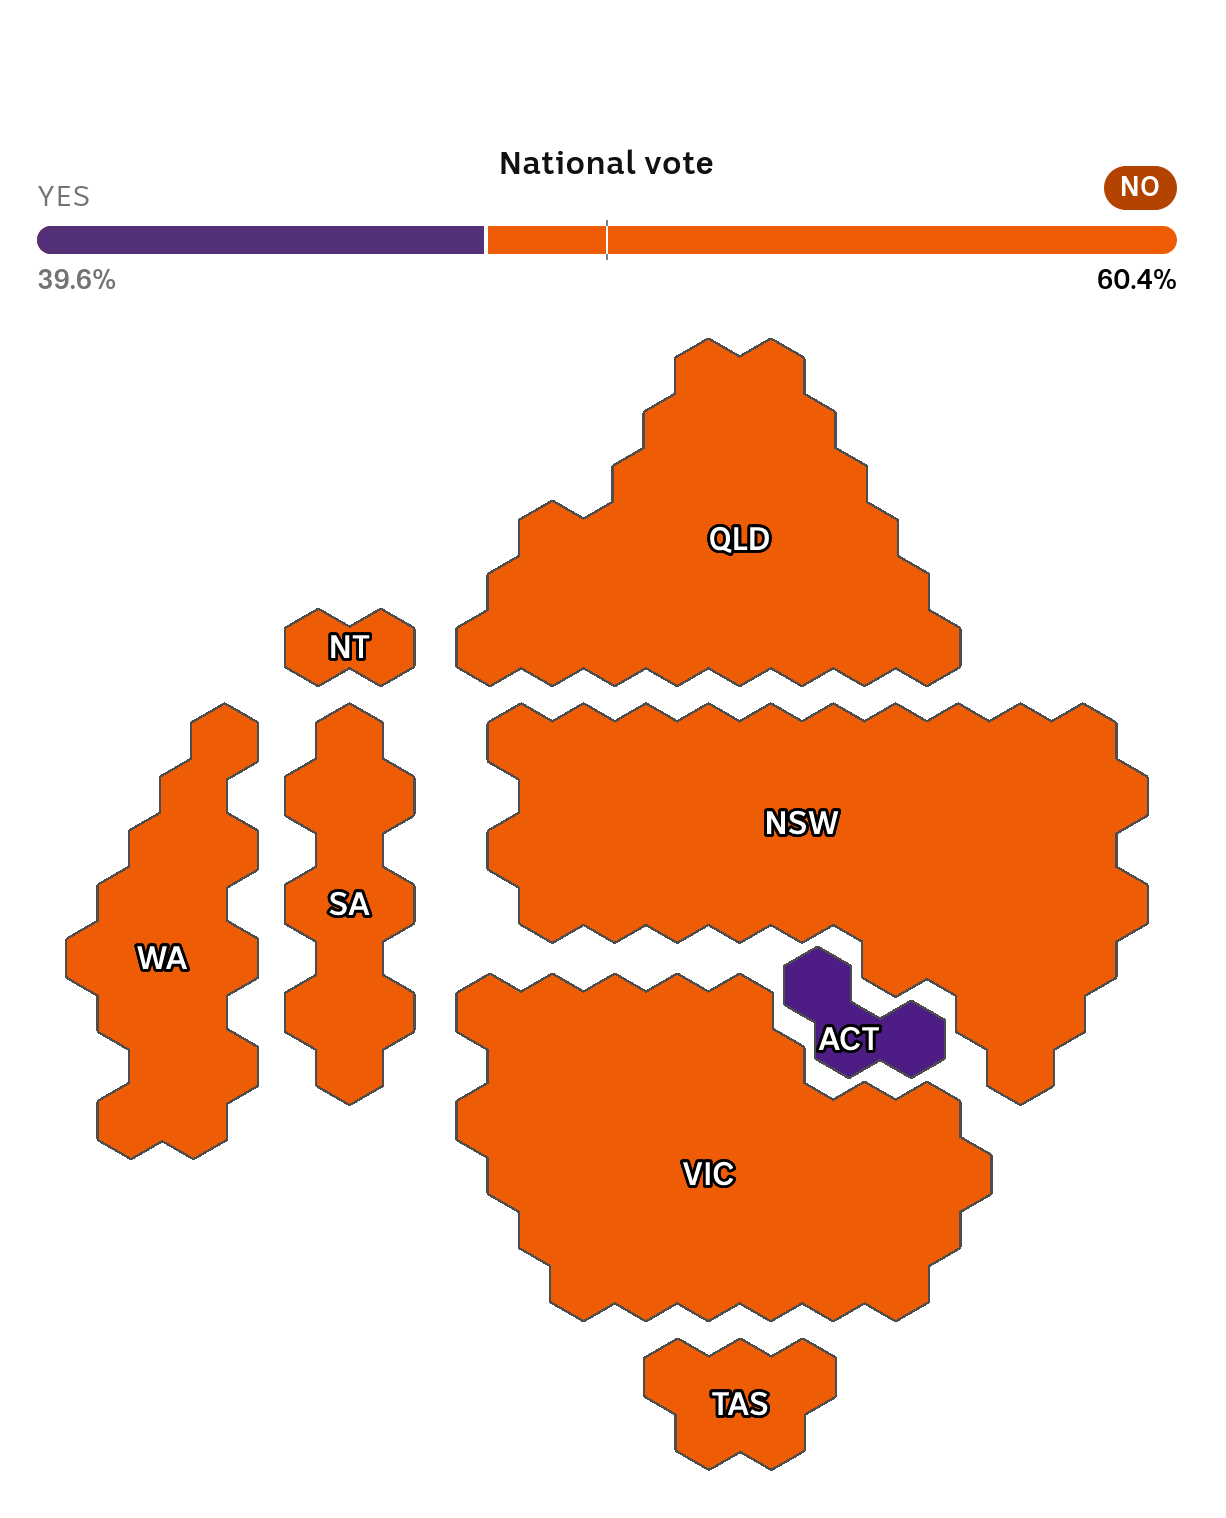
What we’ve done here is re-sized the states based on how many people live in them.
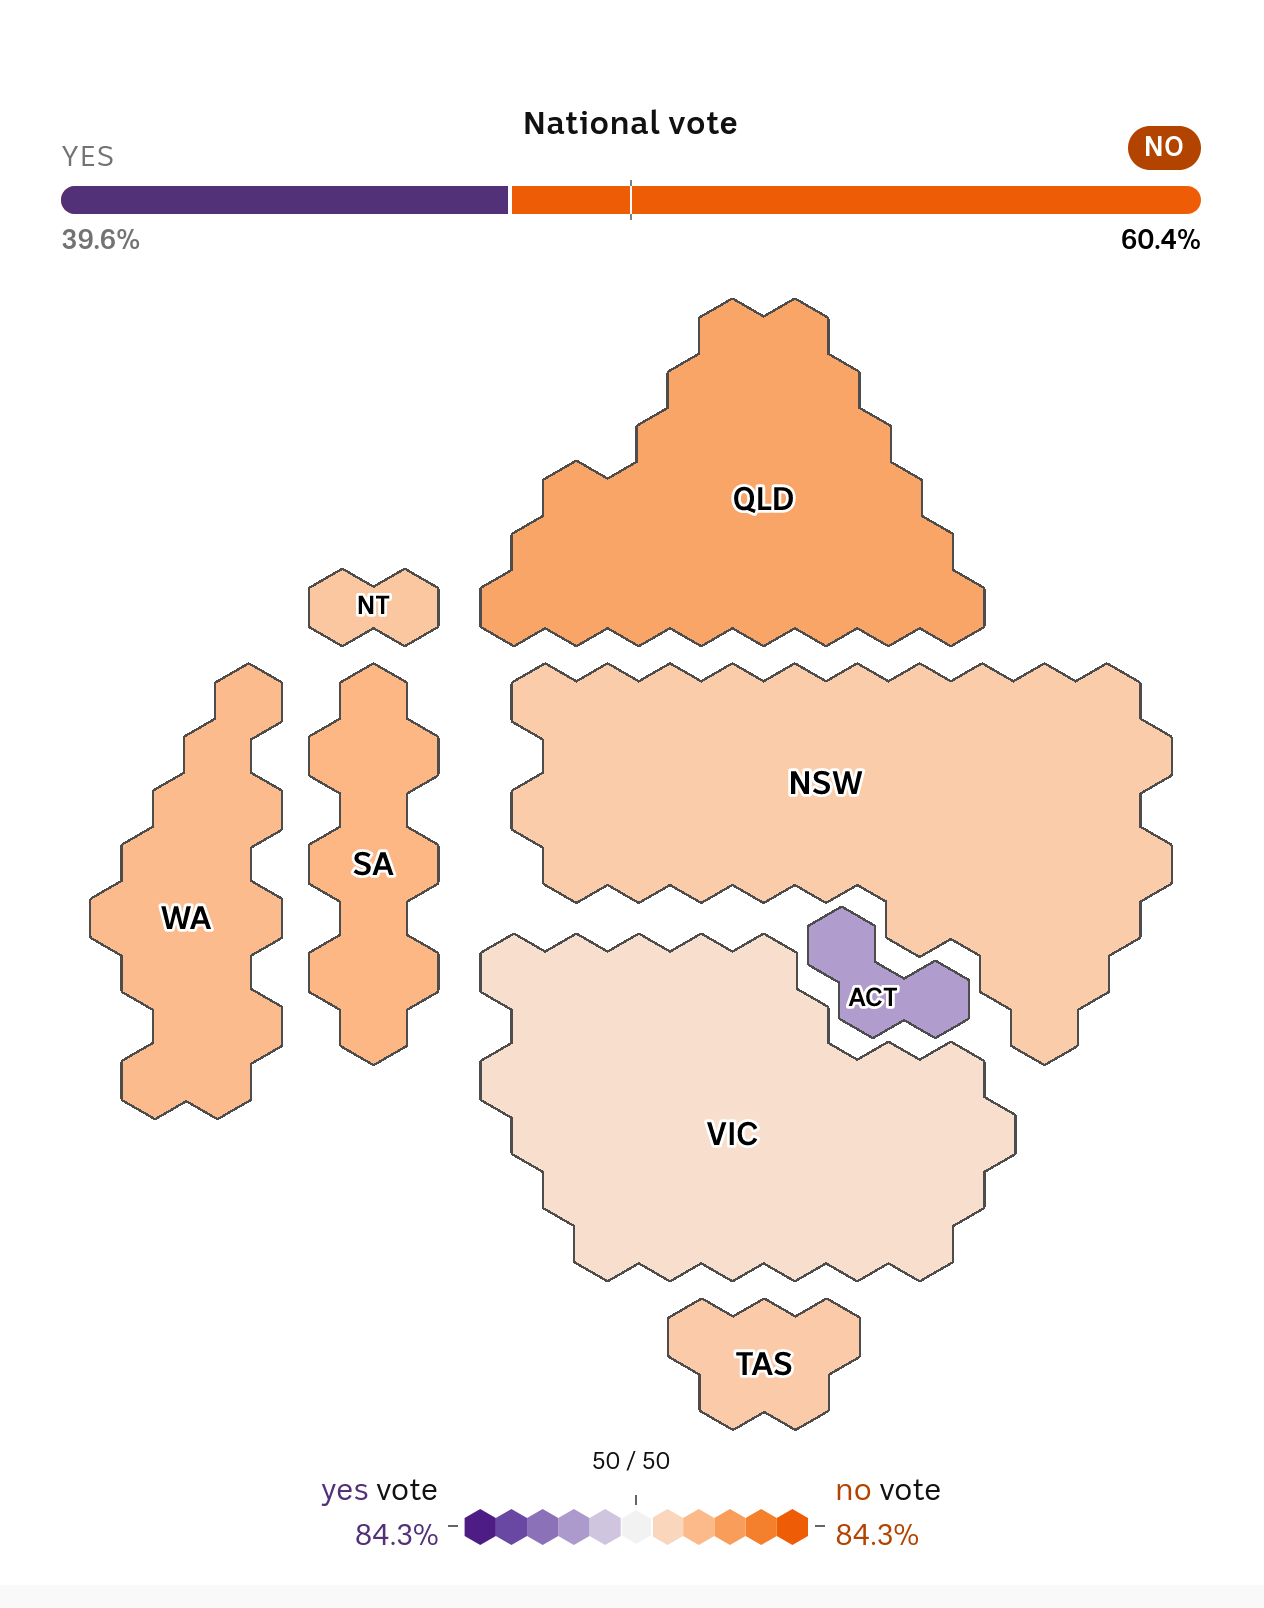
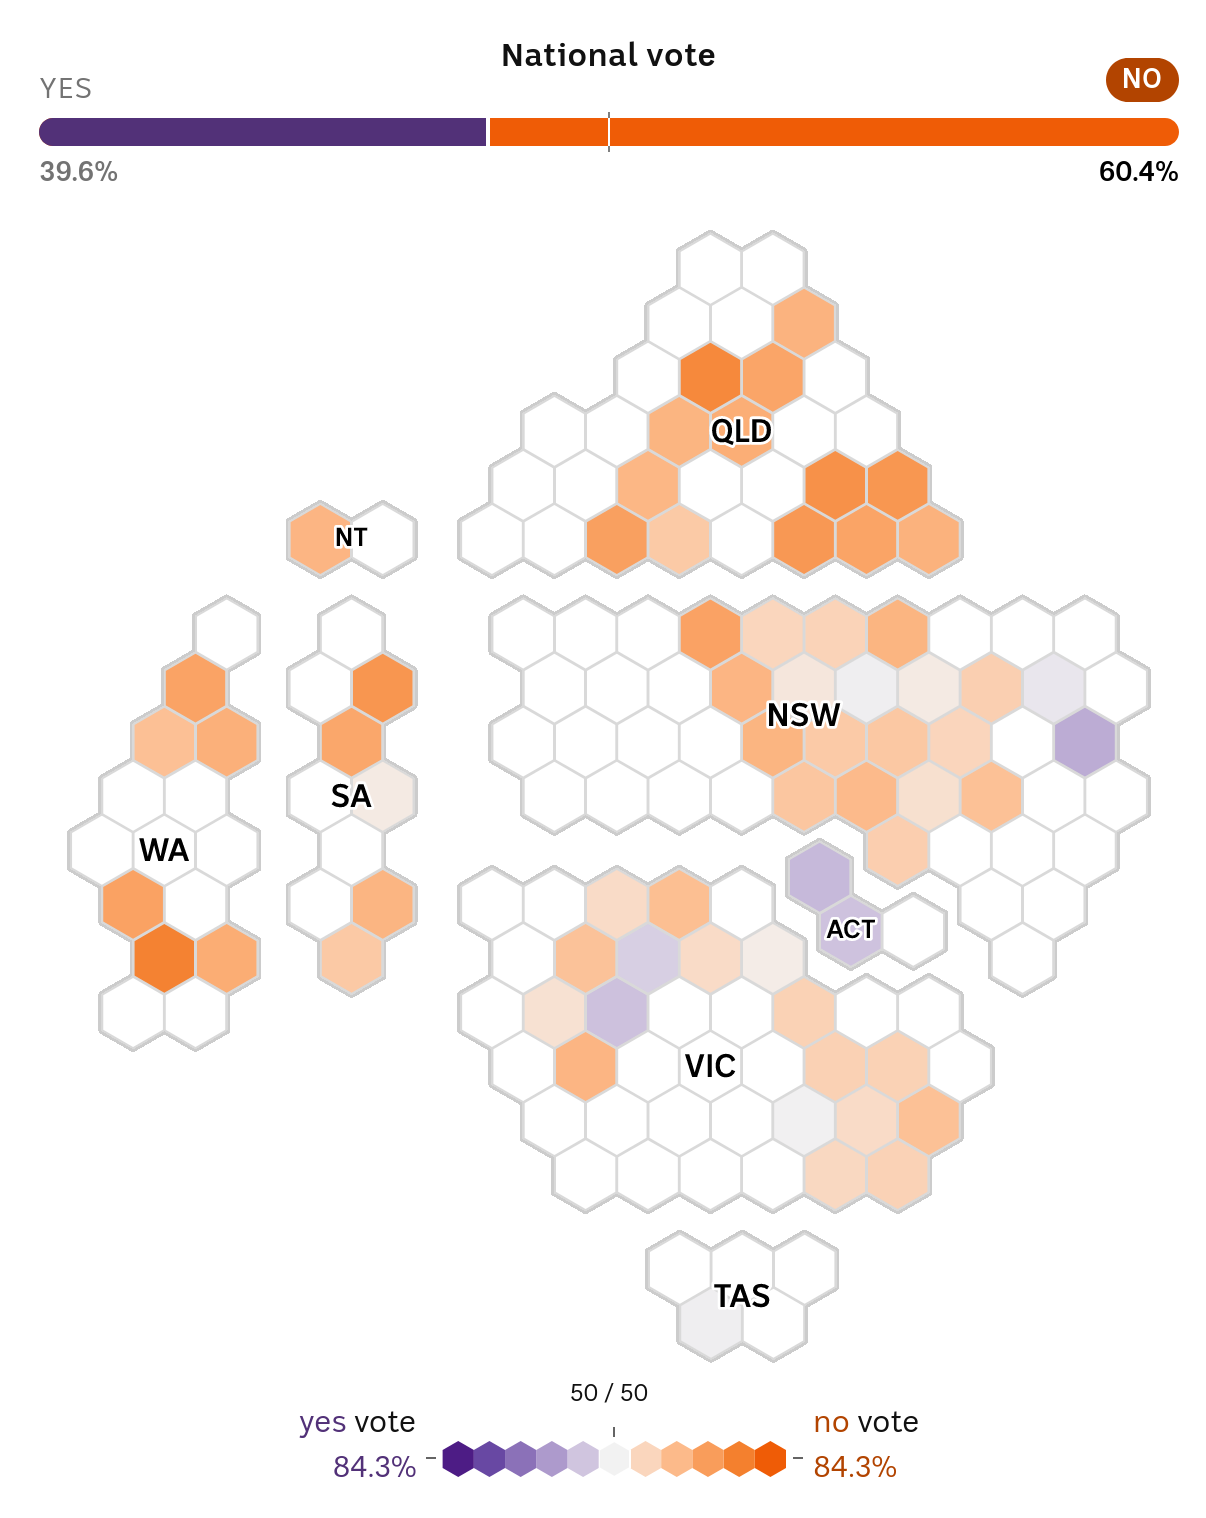
Now, let’s switch to a more nuanced view of the result, one that takes into account the strength of the vote in each state.
The darker the orange, the stronger the No vote.
As you can see, Queensland voted much more strongly No than Victoria.
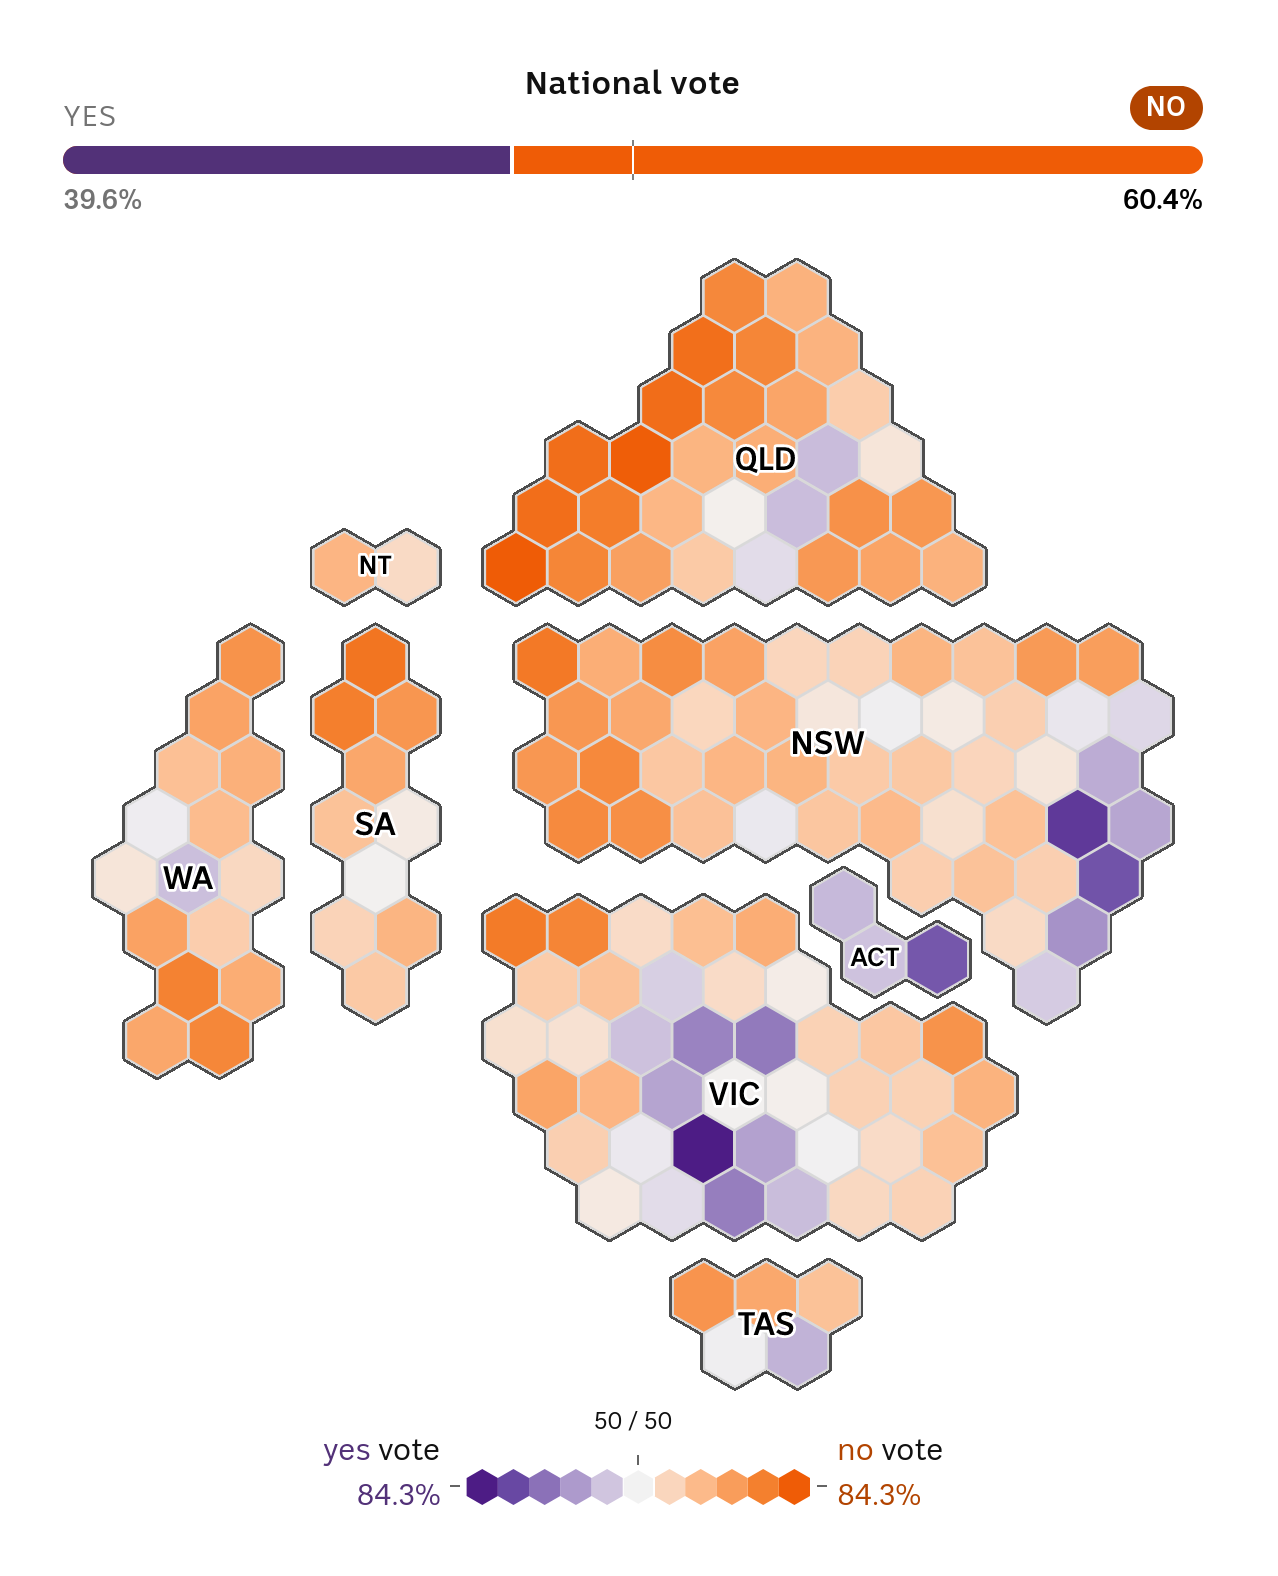
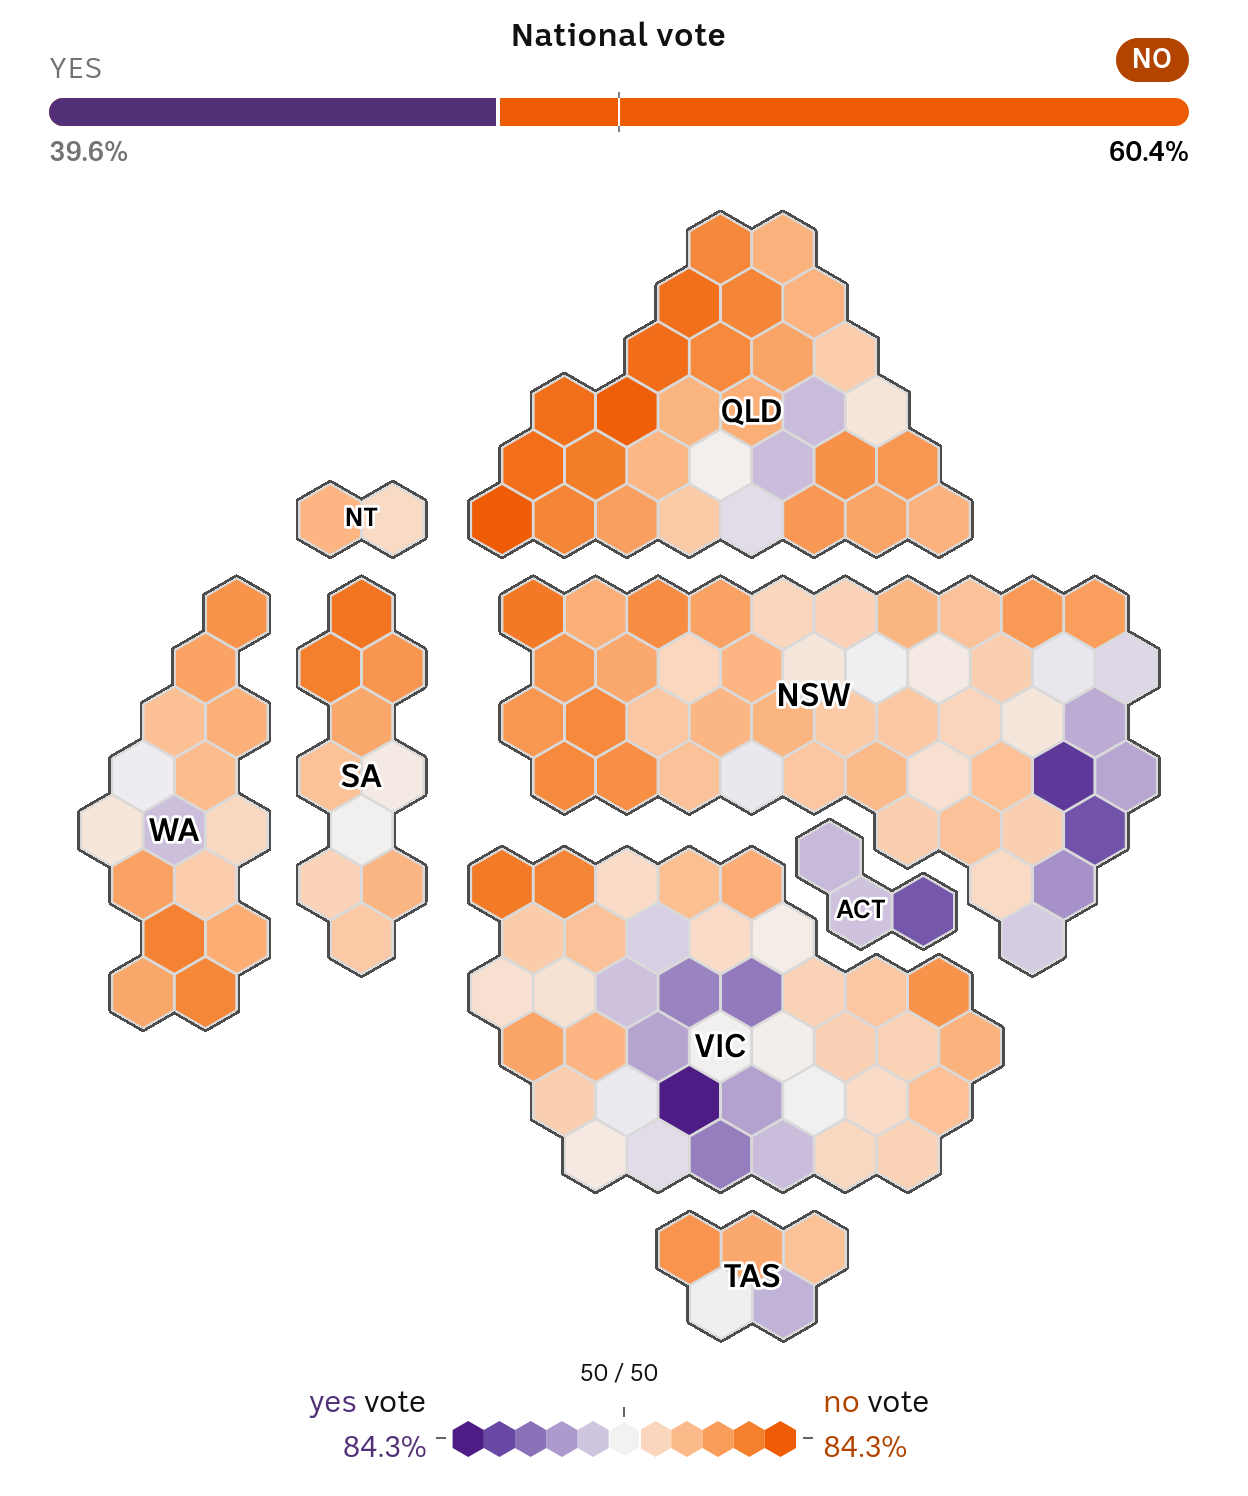
While referendums are decided by how people vote on a state and national level, if we look at how Australians voted in every electorate, a very different picture emerges.
Suddenly, we have a tapestry — orange still predominates but there are patches of purple for Yes, as well as grey areas where the vote was close to an even split.
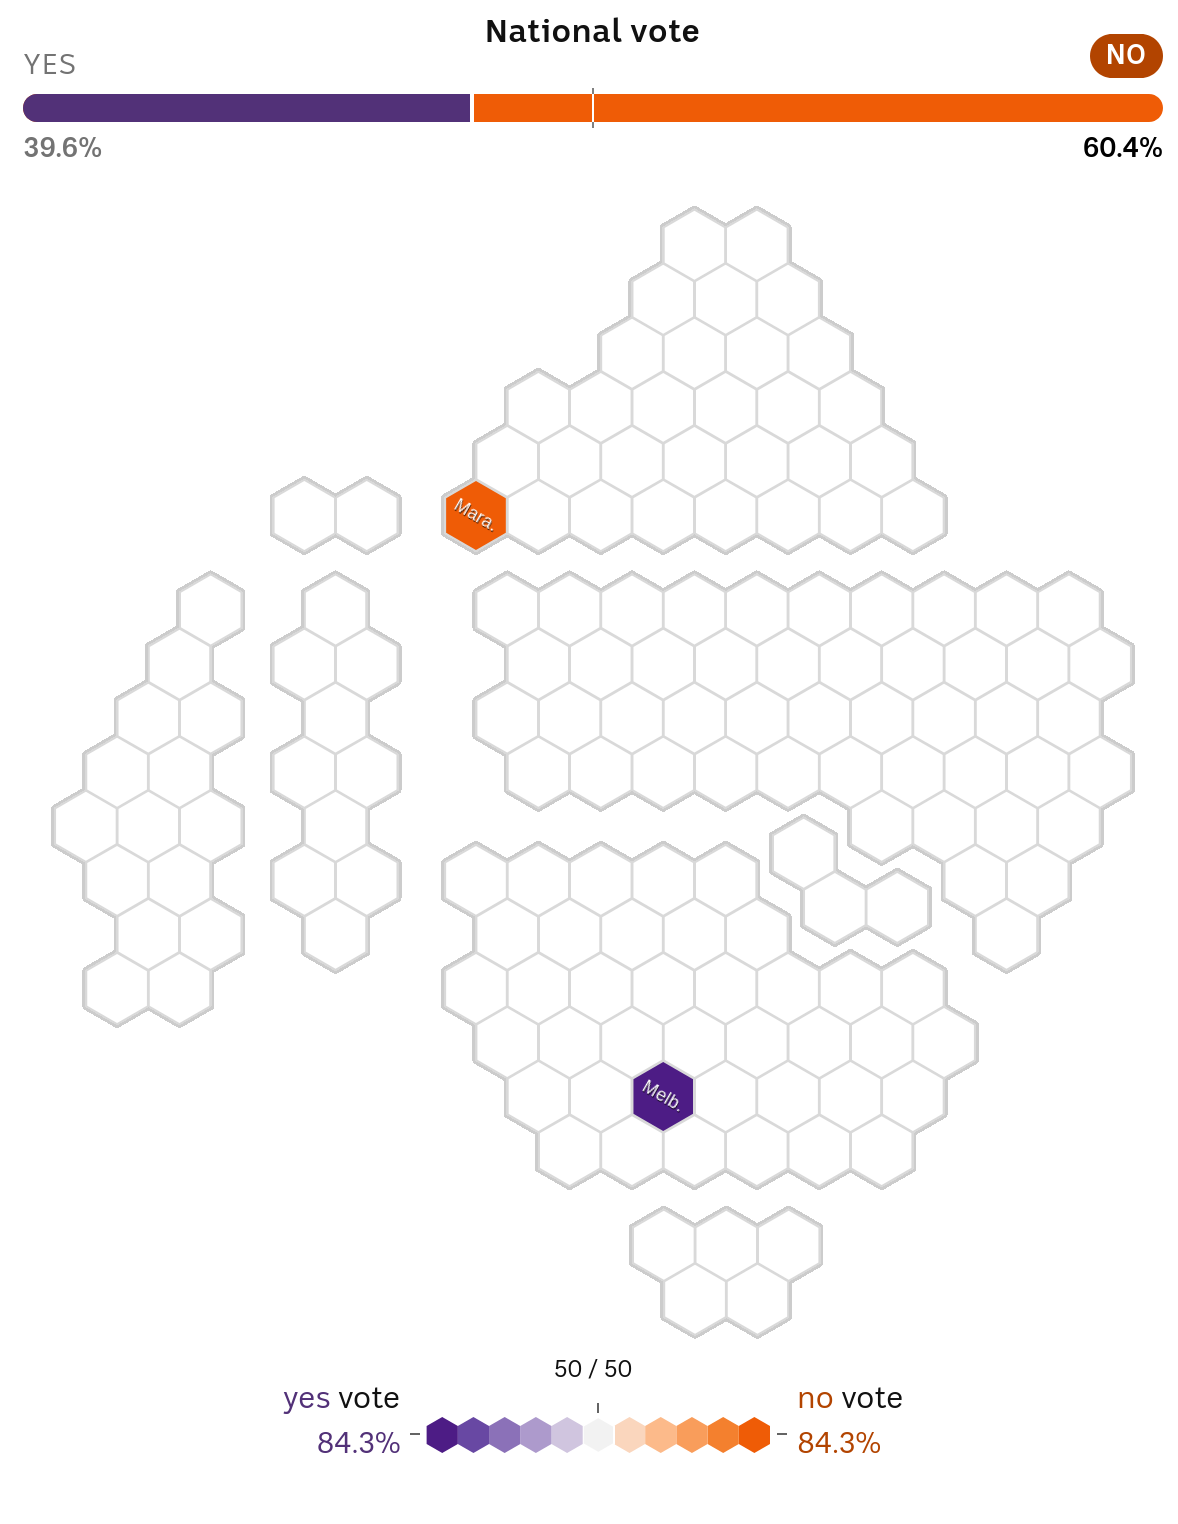
A quick look at the extremes is worthwhile here …
The regional Queensland seat of Maranoa has the highest No vote in the country — topping 80 per cent — while inner-city Melbourne is the strongest Yes.
Curiously, these seats at opposite ends of the country have at least one thing in common. Their sitting members are both party leaders — the Nationals’ David Littleproud in Maranoa and the Greens’ Adam Bandt in Melbourne.
We’re going to hear more about these two seats a little later on.
But for now let’s just say these two seats sit at opposite ends of a trend that played out across the nation.

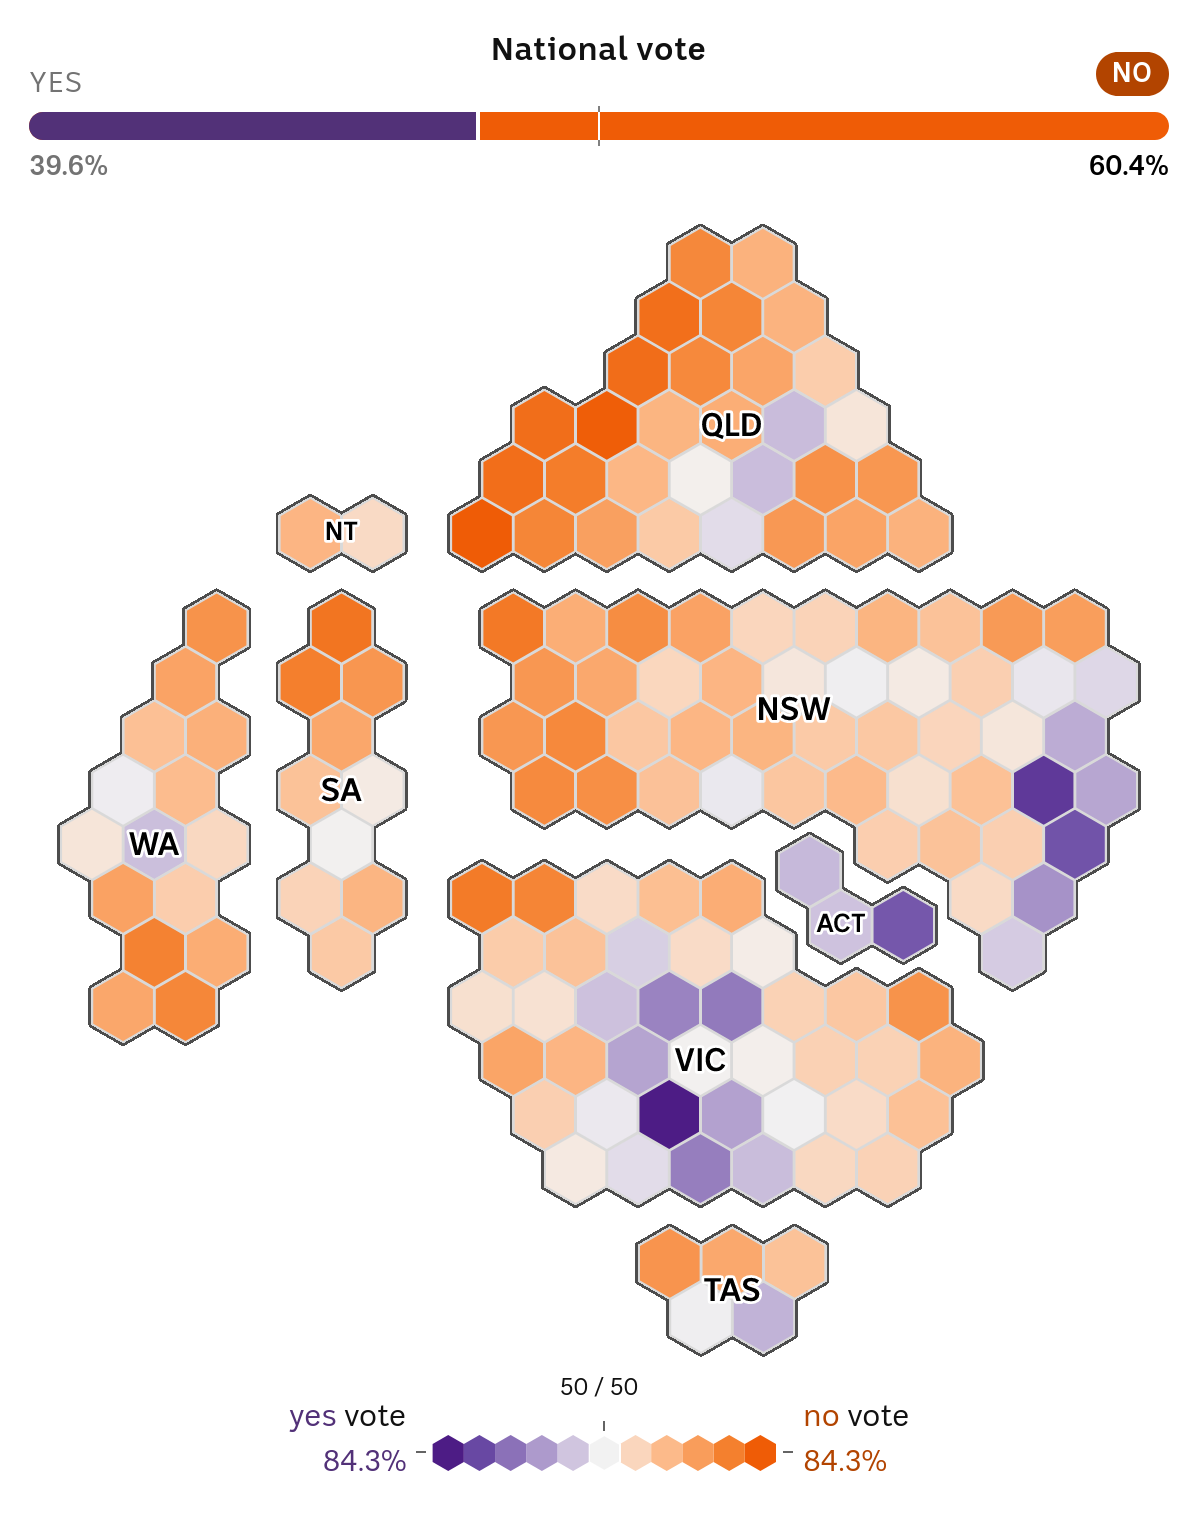
Here’s a snapshot of the inner-city seats across our capital cities — as you can see, these are the country’s Yes hotspots.
However, that core of support quickly drops away when you look at the outer-metropolitan suburbs.
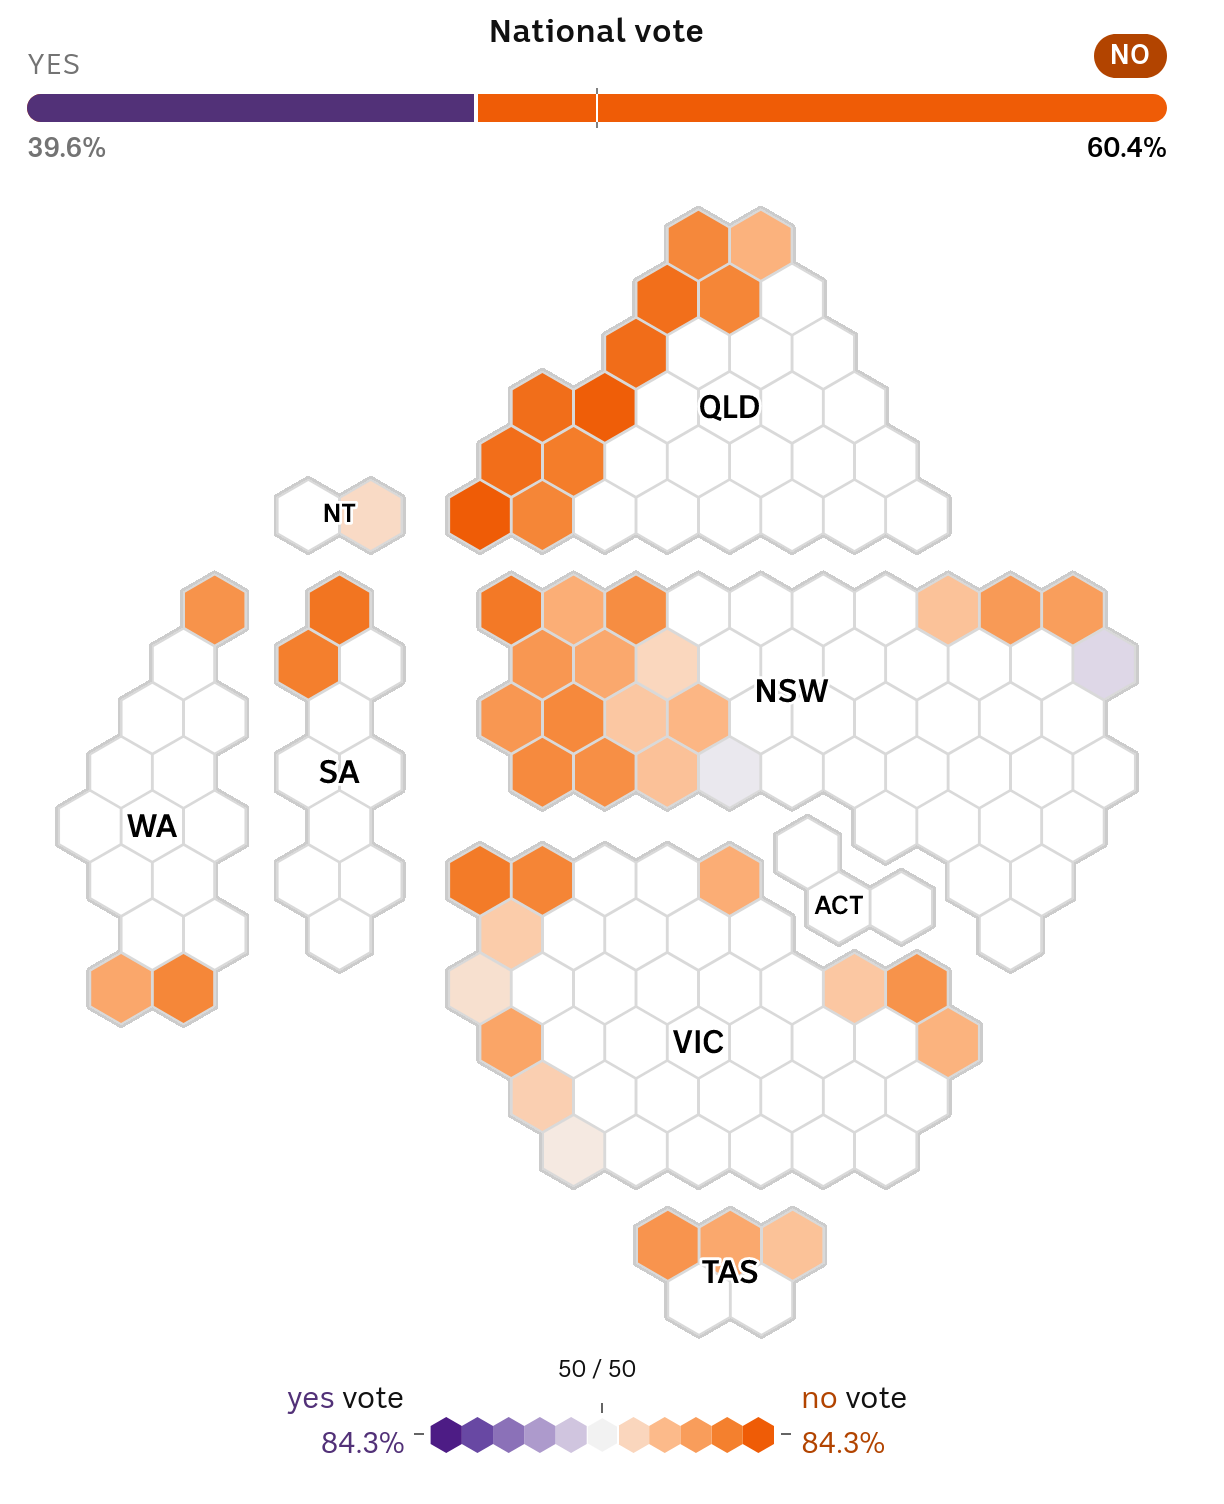
And in regional and rural Australia there is very strong opposition to the Voice.
You can see this trend at play even in Victoria, the state with the highest Yes vote overall.
While these maps give us an indication of how different parts of the country voted, the voting data has more to tell us.
By looking at the results through a different lens, we can start to sketch out a picture of what might have driven votes across the country.
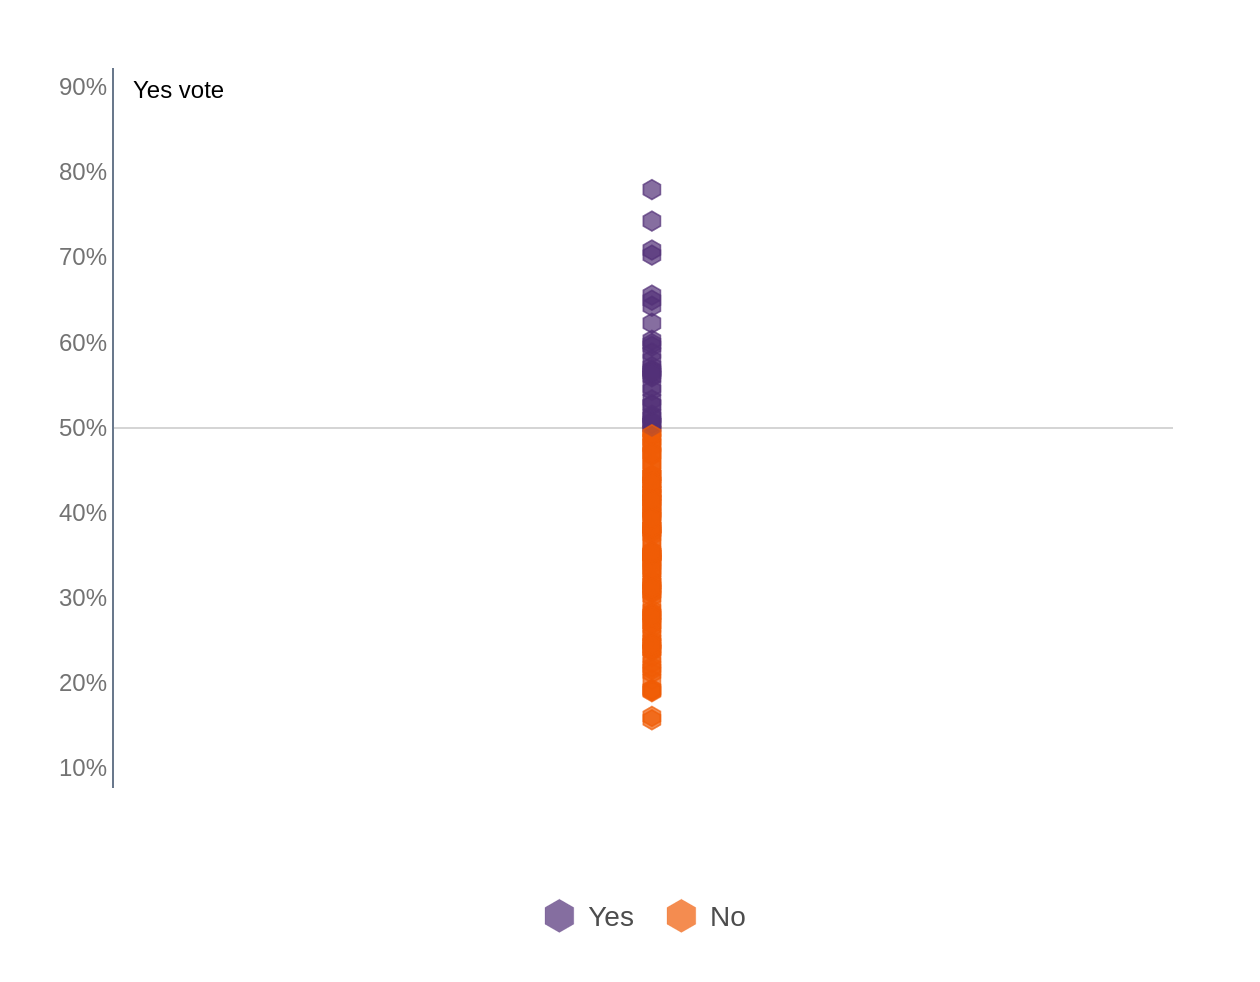
Here are all the electorates lined up based on their Yes vote, so those with a stronger support for Yes appear higher on the chart.
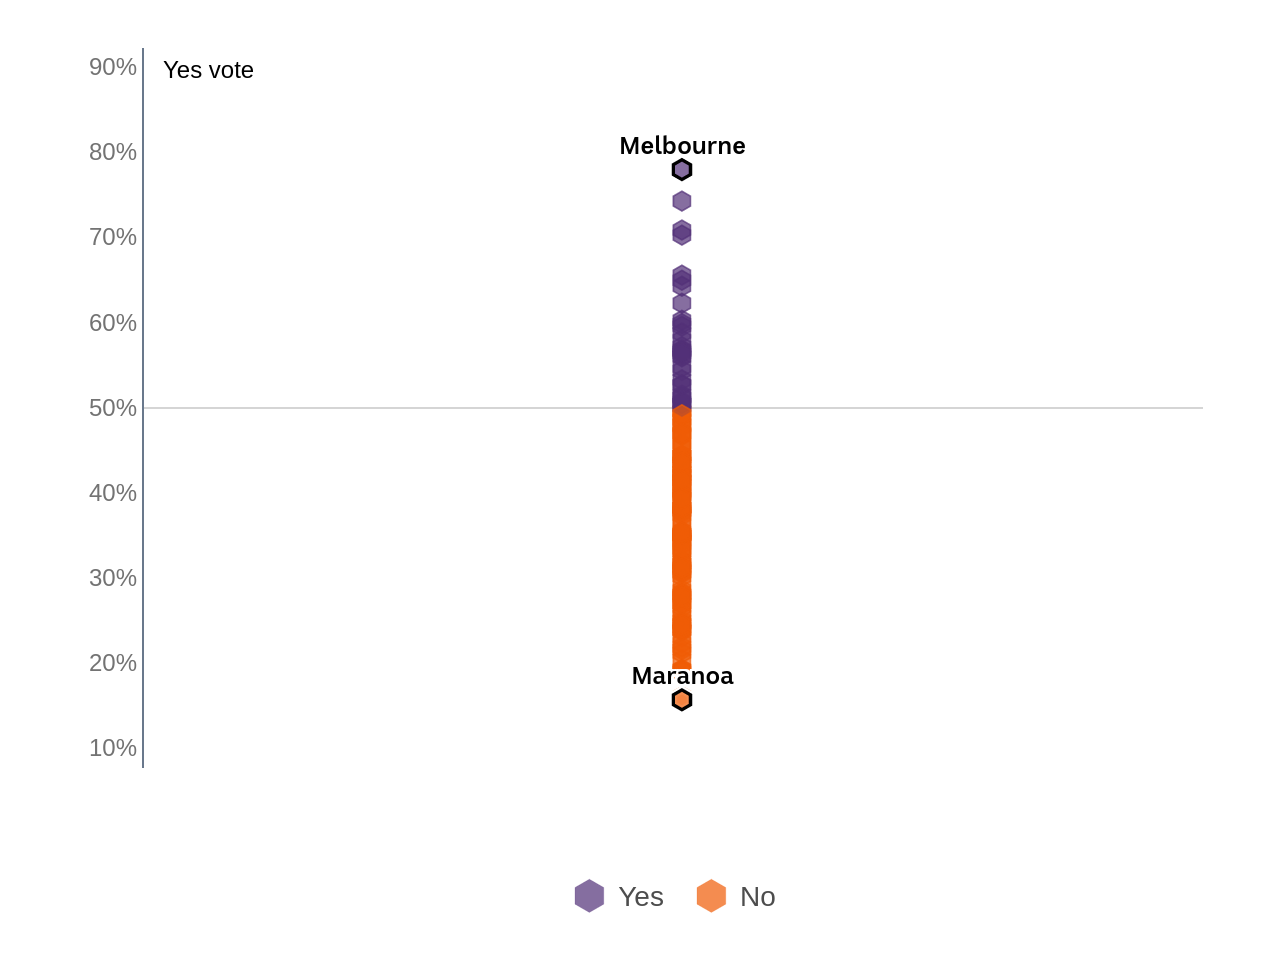
Looking at it this way, you can see Melbourne all the way up the top, and to Maranoa down the bottom.

Charting the vote against how far electorates are from their state’s capital city starkly shows what’s evident on the map — the further they were from the city, the more likely voters were to vote No.
This steady drop-off of support is evident when we look at who lives in each electorate.
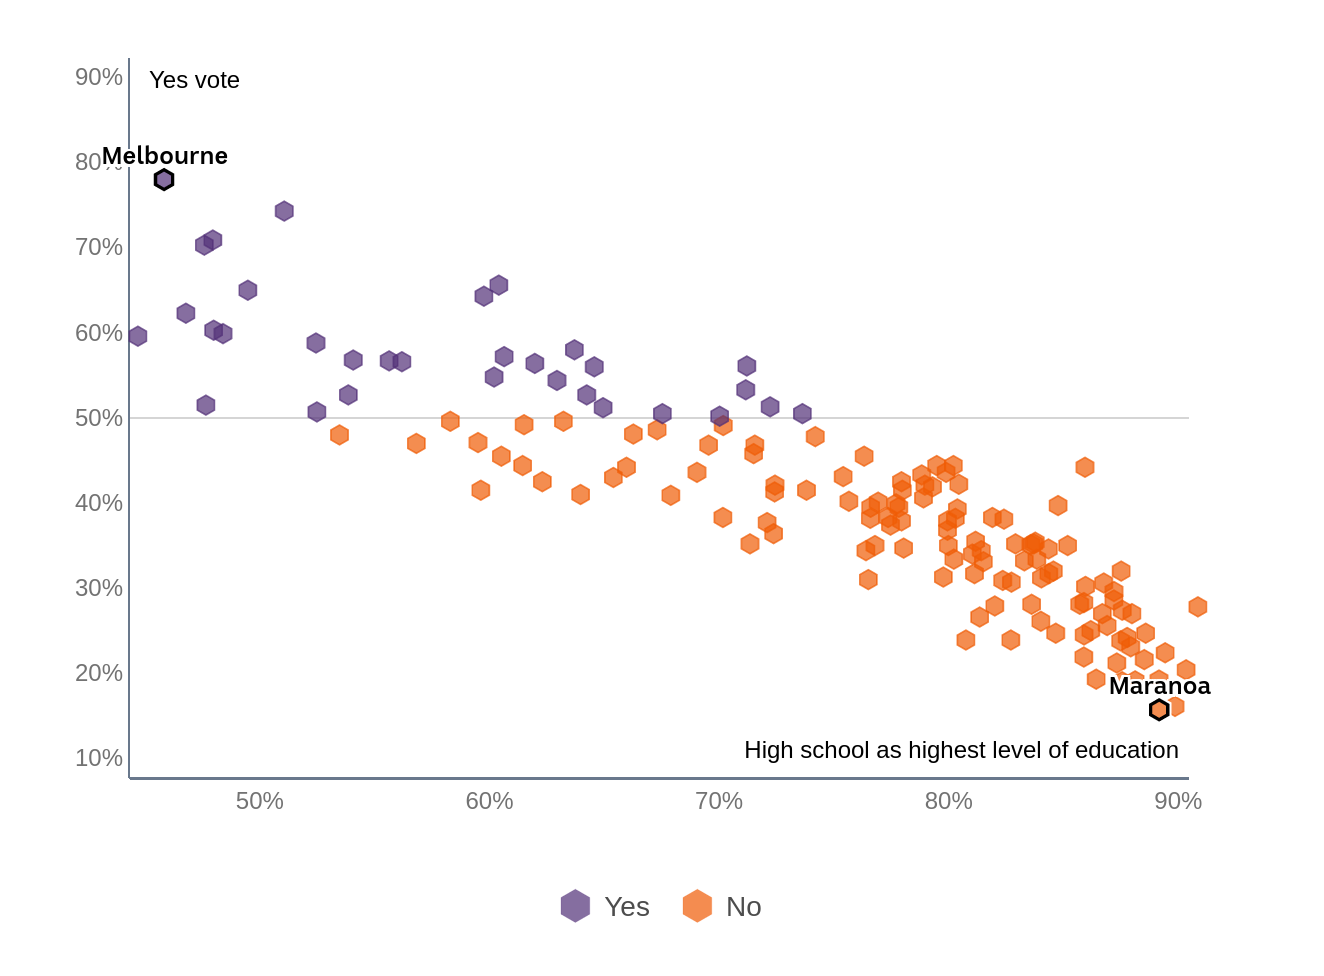
When we switch the horizontal axis to show the level of educational achievement, individual seats shift but the shape remains the same.
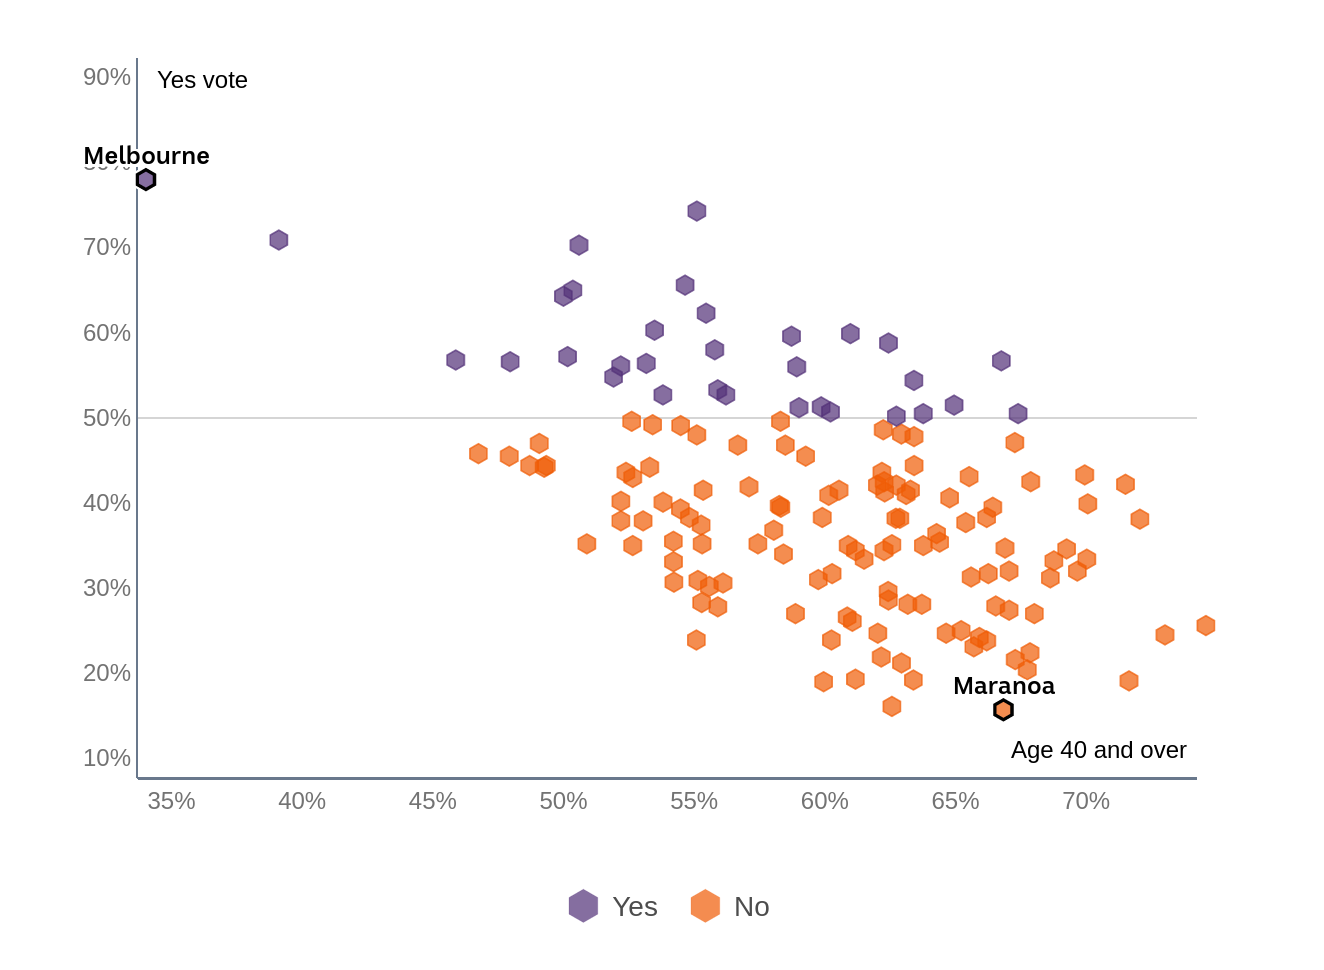
A similar pattern plays out with age.
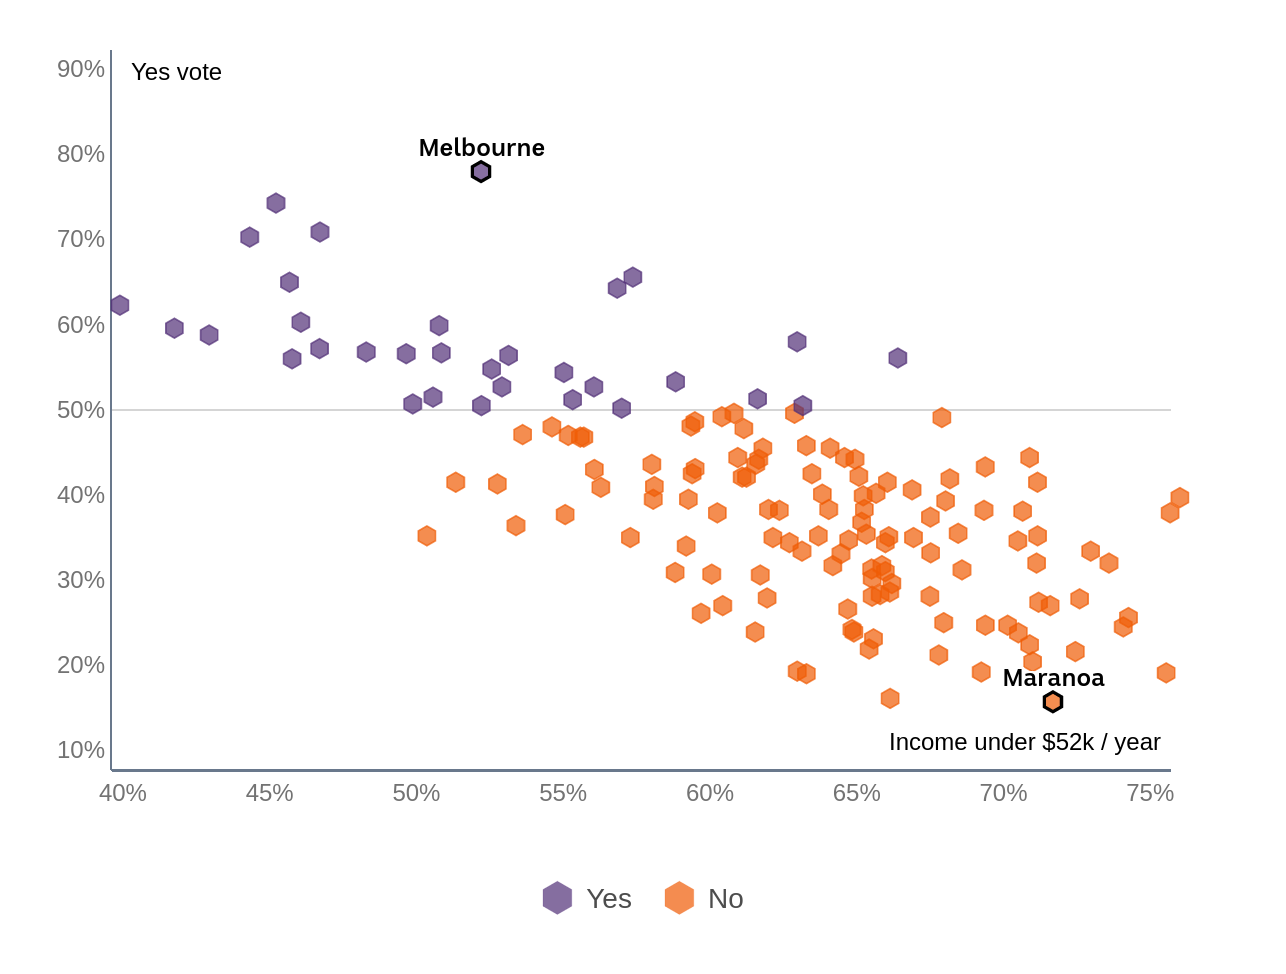
And again with income.
We don’t know if any of these factors are the reason why people voted against the Voice, but what they do show is that it failed to resonate with a wide group of Australians.
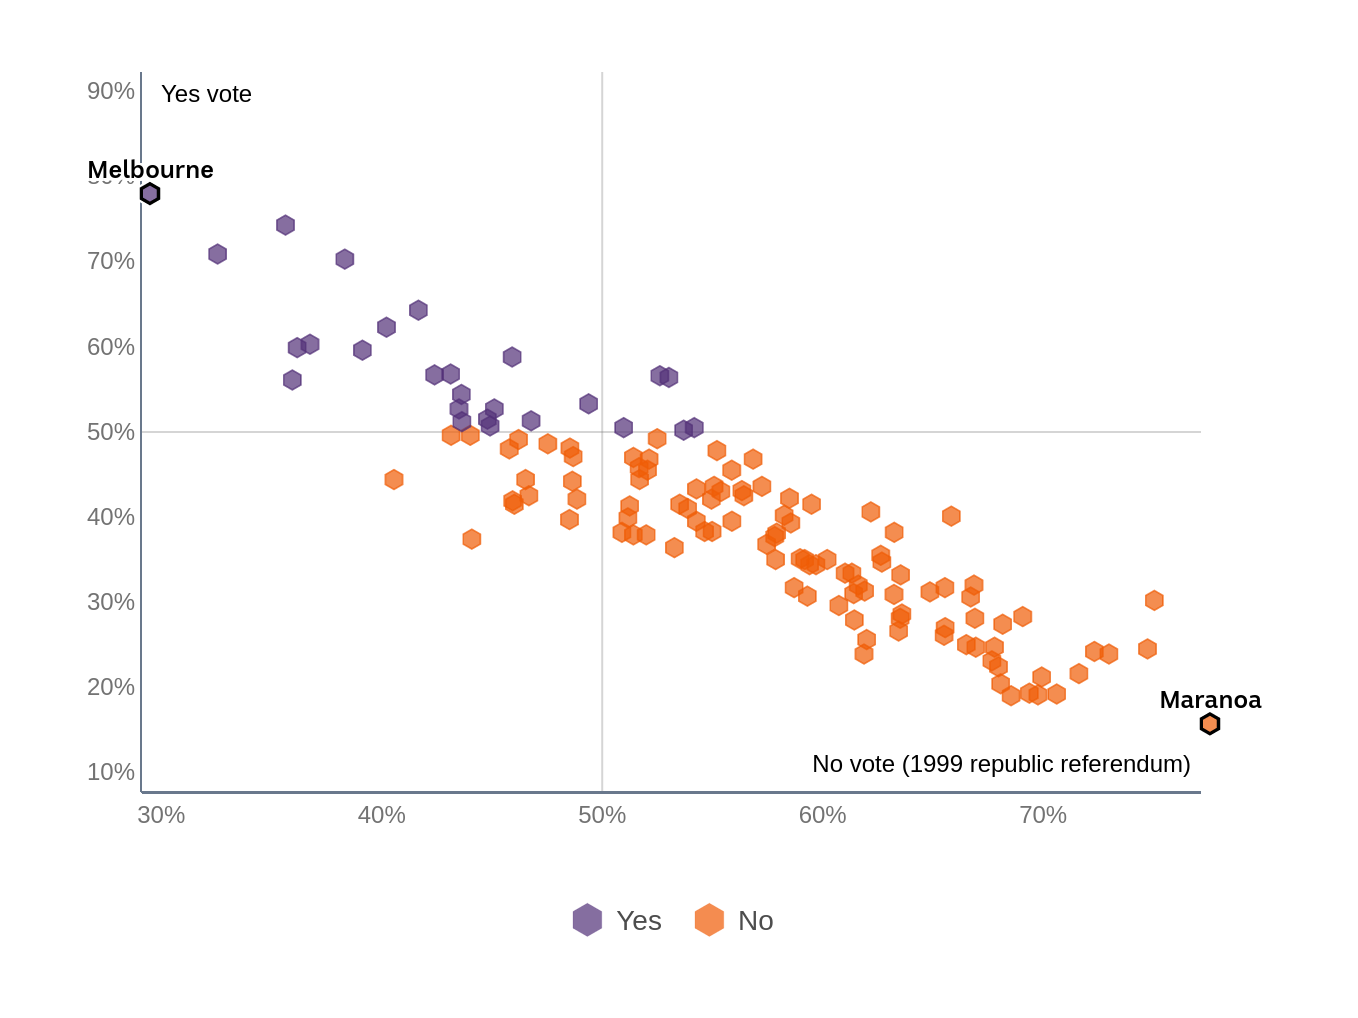
Tellingly, they also show how similar the results are to the last time we had a referendum.

Let’s look at the No vote for the 1999 Republic referendum on the horizontal axis.
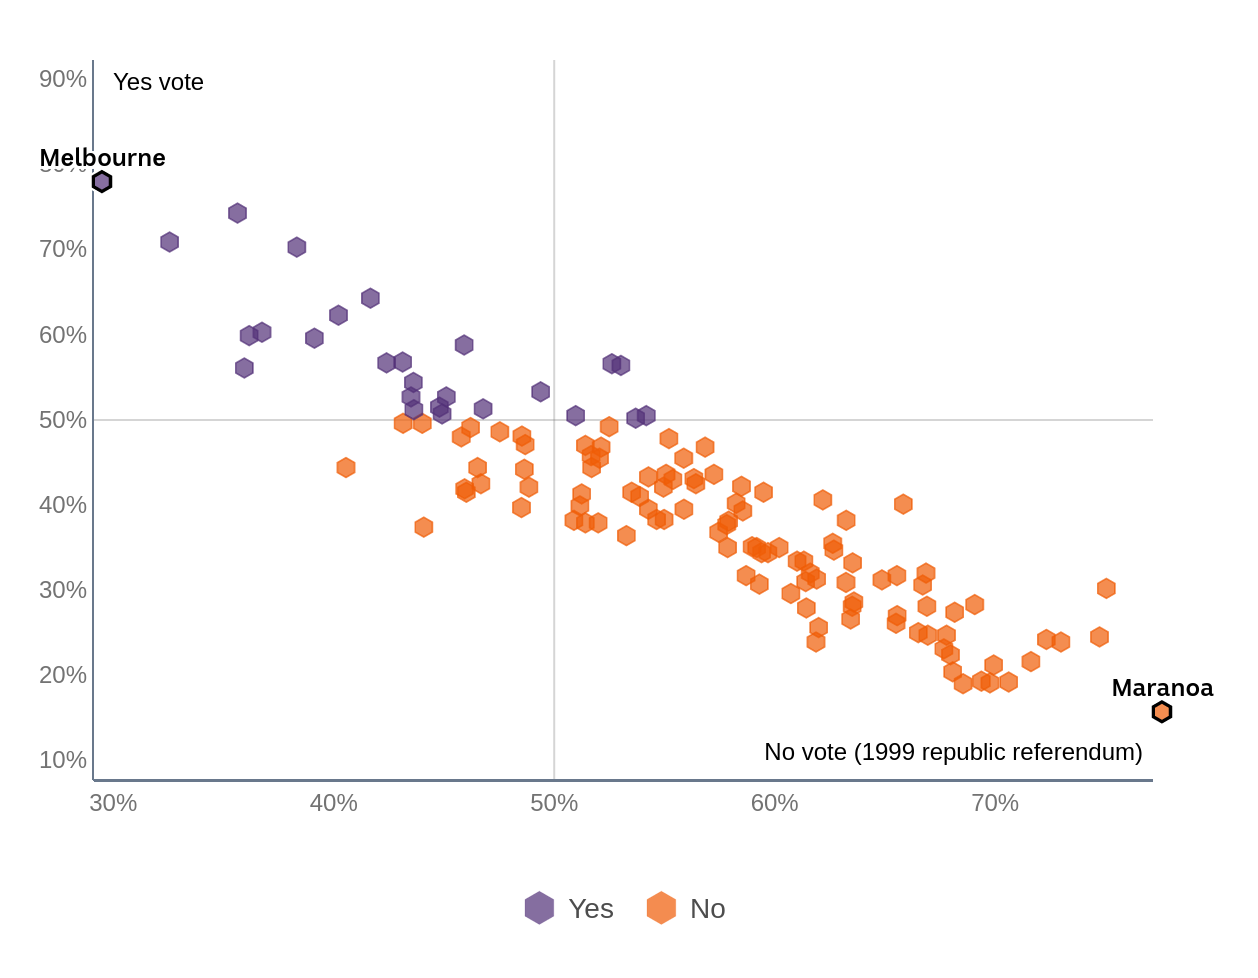
From Melbourne to Maranoa, the majority of electorates that voted against a republic in 1999 have repeated history.
A generation has passed, people born after the referendum are now adults, and yet only a handful of seats have voted differently.
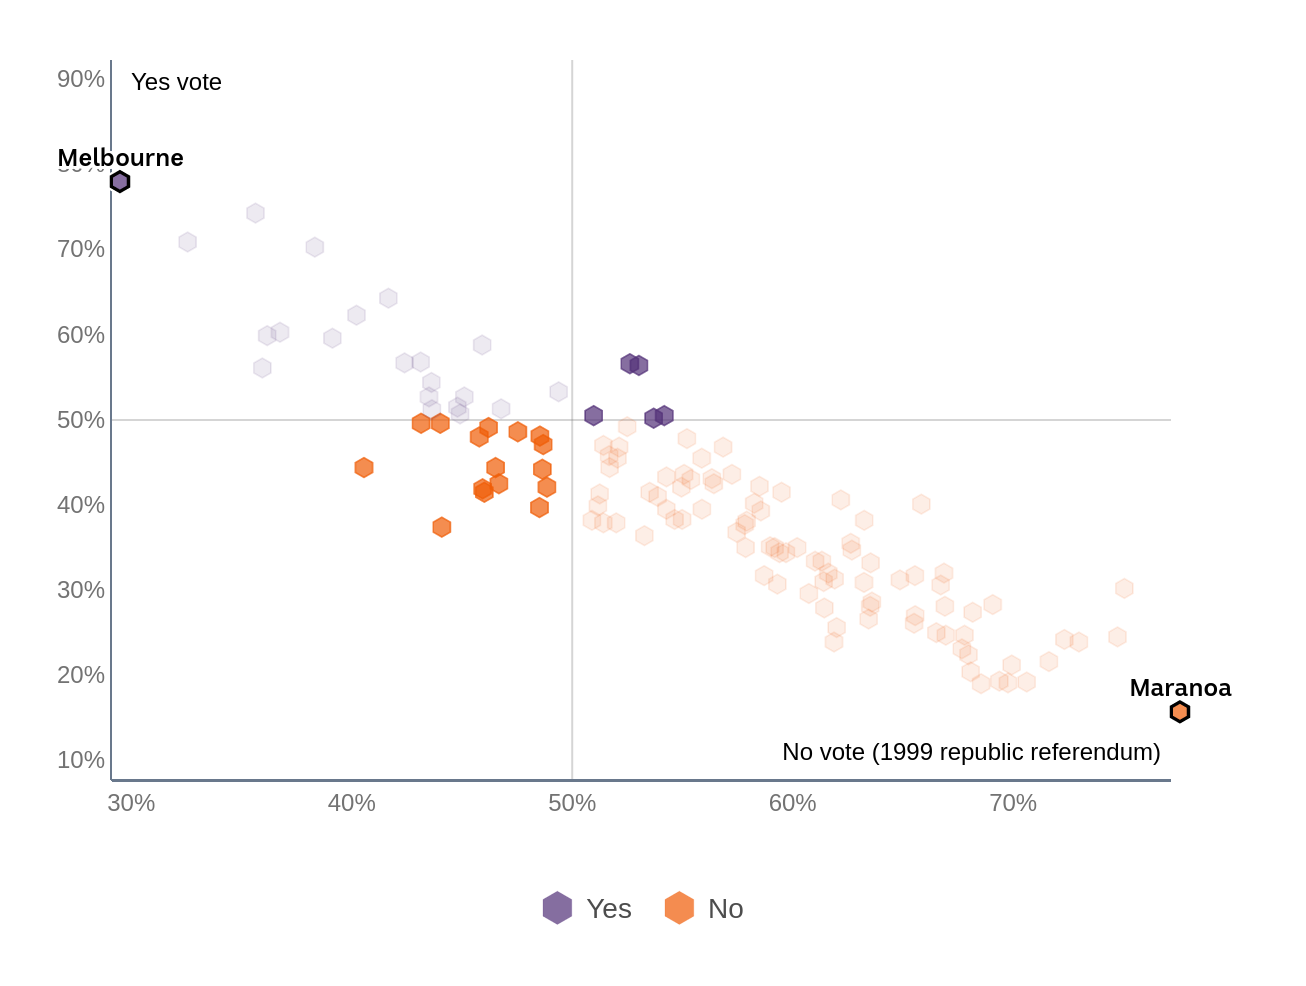
The highlighted purple hexagons are those that voted No in 1999 but Yes in 2023, and the highlighted orange electorates went the other way.
Despite all the differences between the two referendums — the same areas that were resistant to change, and those that embraced it, have hardly shifted at all.
What also hasn’t shifted in the past two decades is the divide between the lives Indigenous Australians can hope to lead, and those of the rest of the country.
The journey to the 2023 vote was set in motion in 2017 when Indigenous leaders and community members “from all points of the southern sky” met at Uluru and wrote an invitation to the Australian people to walk with them on a path toward “constitutional reforms to empower our people and take a rightful place in our own country”.
That letter asked Australians to listen, and urged us all to support structural reforms to overcome the “torment of [First Nations] powerlessness”:
“Proportionally, we are the most incarcerated people on the planet. We are not an innately criminal people. Our children are alienated from their families at unprecedented rates. This cannot be because we have no love for them. And our youth languish in detention in obscene numbers. They should be our hope for the future.”
Neither side of the Voice debate denied the need for Australia to create a better future for First Nations children.
But, by majority vote, Australians have made clear that a constitutionally enshrined Voice to Parliament is not how they want to respond to these crises.
An urgent question emerges — what is?

Amazing write up, thank you.
That last question is what the coalition and the No voters have to answer now, now that they have successfully campaigned that this isn’t the right way to go about it.
Omg thank you!
I’mma try and copy/paste this into comment or two for shits and giggles. In the meantime if someone could create a website that turns interactive articles into regular articles that would be great.
“Reader mode” in my browser converted this article into something perfectly readable. It still hand single sentence paragraphs but otherwise nothing wrong with it.
I tried reader mode in firefox but only got the first half a dozen paragraphs.

Thankfully Firefox’s reader mode can make some sense of it.
“ODYSSEY FORMAT BY ABC NEWS STORY LAB”
Pitchforks out! 🔱
I’m here for it 🔱🔱🔱
I think it’s interesting that the strongest No vote was in parts of the country with more indigenous people.
Maranoa is about 10% indigenous and had the highest No vote in the country. The ACT, the only electorates with a clear Yes vote, are just 1.5% indigenous.
It depends if you look at whole electorates or get more specific. See: https://www.theguardian.com/australia-news/2023/oct/15/indigenous-communities-overwhelmingly-voted-yes-to-australias-voice-to-parliament
I suspect it’s more that indigenous communities are surrounded by white “no” voters.
Sure. I’m not suggesting indigenous communities voted No. Obviously most of them voted Yes… this whole thing was kicked off because the indigenous community asked for a constitutionally recognised voice.
My point was more that the Yes campaign was more successful among communities who rarely interact with indigenous people.
That’s one way to look at it, but there are many other characteristics such as education, income, distance from capital cities, age etc that are associated with a “no” vote.
If you look at Maranoa for instance, it is associated strongly with all of those (and as a side note, was also the electorate that voted most strongly against the 1999 referendum). And it isn’t too surprising that Indigenous people live in some of these areas, given the issues with disadvantage that kicked off the whole issue.