LMs aren’t thinking, aren’t inventing, they are predicting what is supposed to be answered next, so it’s expected that they will produce the same results every time
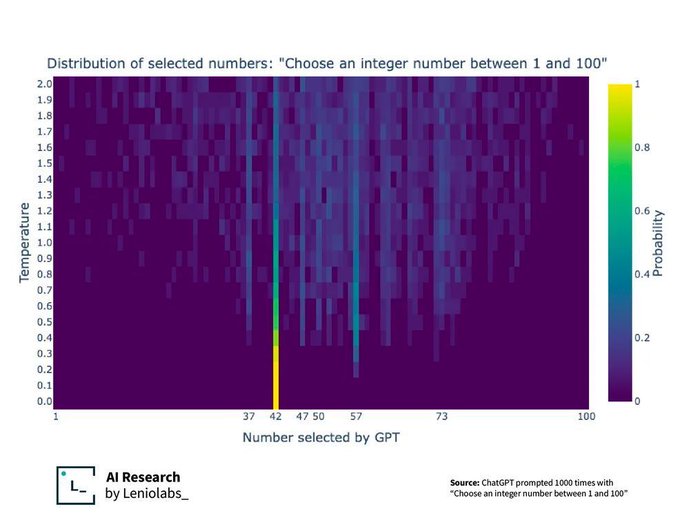
This graph actually shows a little more about what’s happening with the randomness or “temperature” of the LLM.
It’s actually predicting the probability of every word (token) it knows of coming next, all at once.
The temperature then says how random it should be when picking from that list of probable next words. A temperature of 0 means it always picks the most likely next word, which in this case ends up being 42.
As the temperature increases, it gets more random (but you can see it still isn’t a perfect random distribution with a higher temperature value)
They add some fuzziness to it so it doesn’t give the exact same result. Say one gets a score of 90, another 85, and other 80. The 90 will be picked more often, but they sometimes let it pick the 85, or even the 80. It’s perfectly expected, and you can see that result here with 42 being very common, but then a few others being fairly common, and most being extremely uncommon.

LMs aren’t thinking, aren’t inventing, they are predicting what is supposed to be answered next, so it’s expected that they will produce the same results every time
This graph actually shows a little more about what’s happening with the randomness or “temperature” of the LLM.
It’s actually predicting the probability of every word (token) it knows of coming next, all at once.
The temperature then says how random it should be when picking from that list of probable next words. A temperature of 0 means it always picks the most likely next word, which in this case ends up being 42.
As the temperature increases, it gets more random (but you can see it still isn’t a perfect random distribution with a higher temperature value)
Except it clearly doesn’t produce the same result every time. You’re not making a good case for whatever you’re trying to say.
They add some fuzziness to it so it doesn’t give the exact same result. Say one gets a score of 90, another 85, and other 80. The 90 will be picked more often, but they sometimes let it pick the 85, or even the 80. It’s perfectly expected, and you can see that result here with 42 being very common, but then a few others being fairly common, and most being extremely uncommon.