lnxtx (xe/xem/xyr) ( lnxtx@feddit.nl ) to 196@lemmy.blahaj.zoneEnglish · 2 years agoVal(r)u(l)efeddit.nlimagemessage-square14linkfedilinkarrow-up163
arrow-up163imageVal(r)u(l)efeddit.nllnxtx (xe/xem/xyr) ( lnxtx@feddit.nl ) to 196@lemmy.blahaj.zoneEnglish · 2 years agomessage-square14linkfedilink
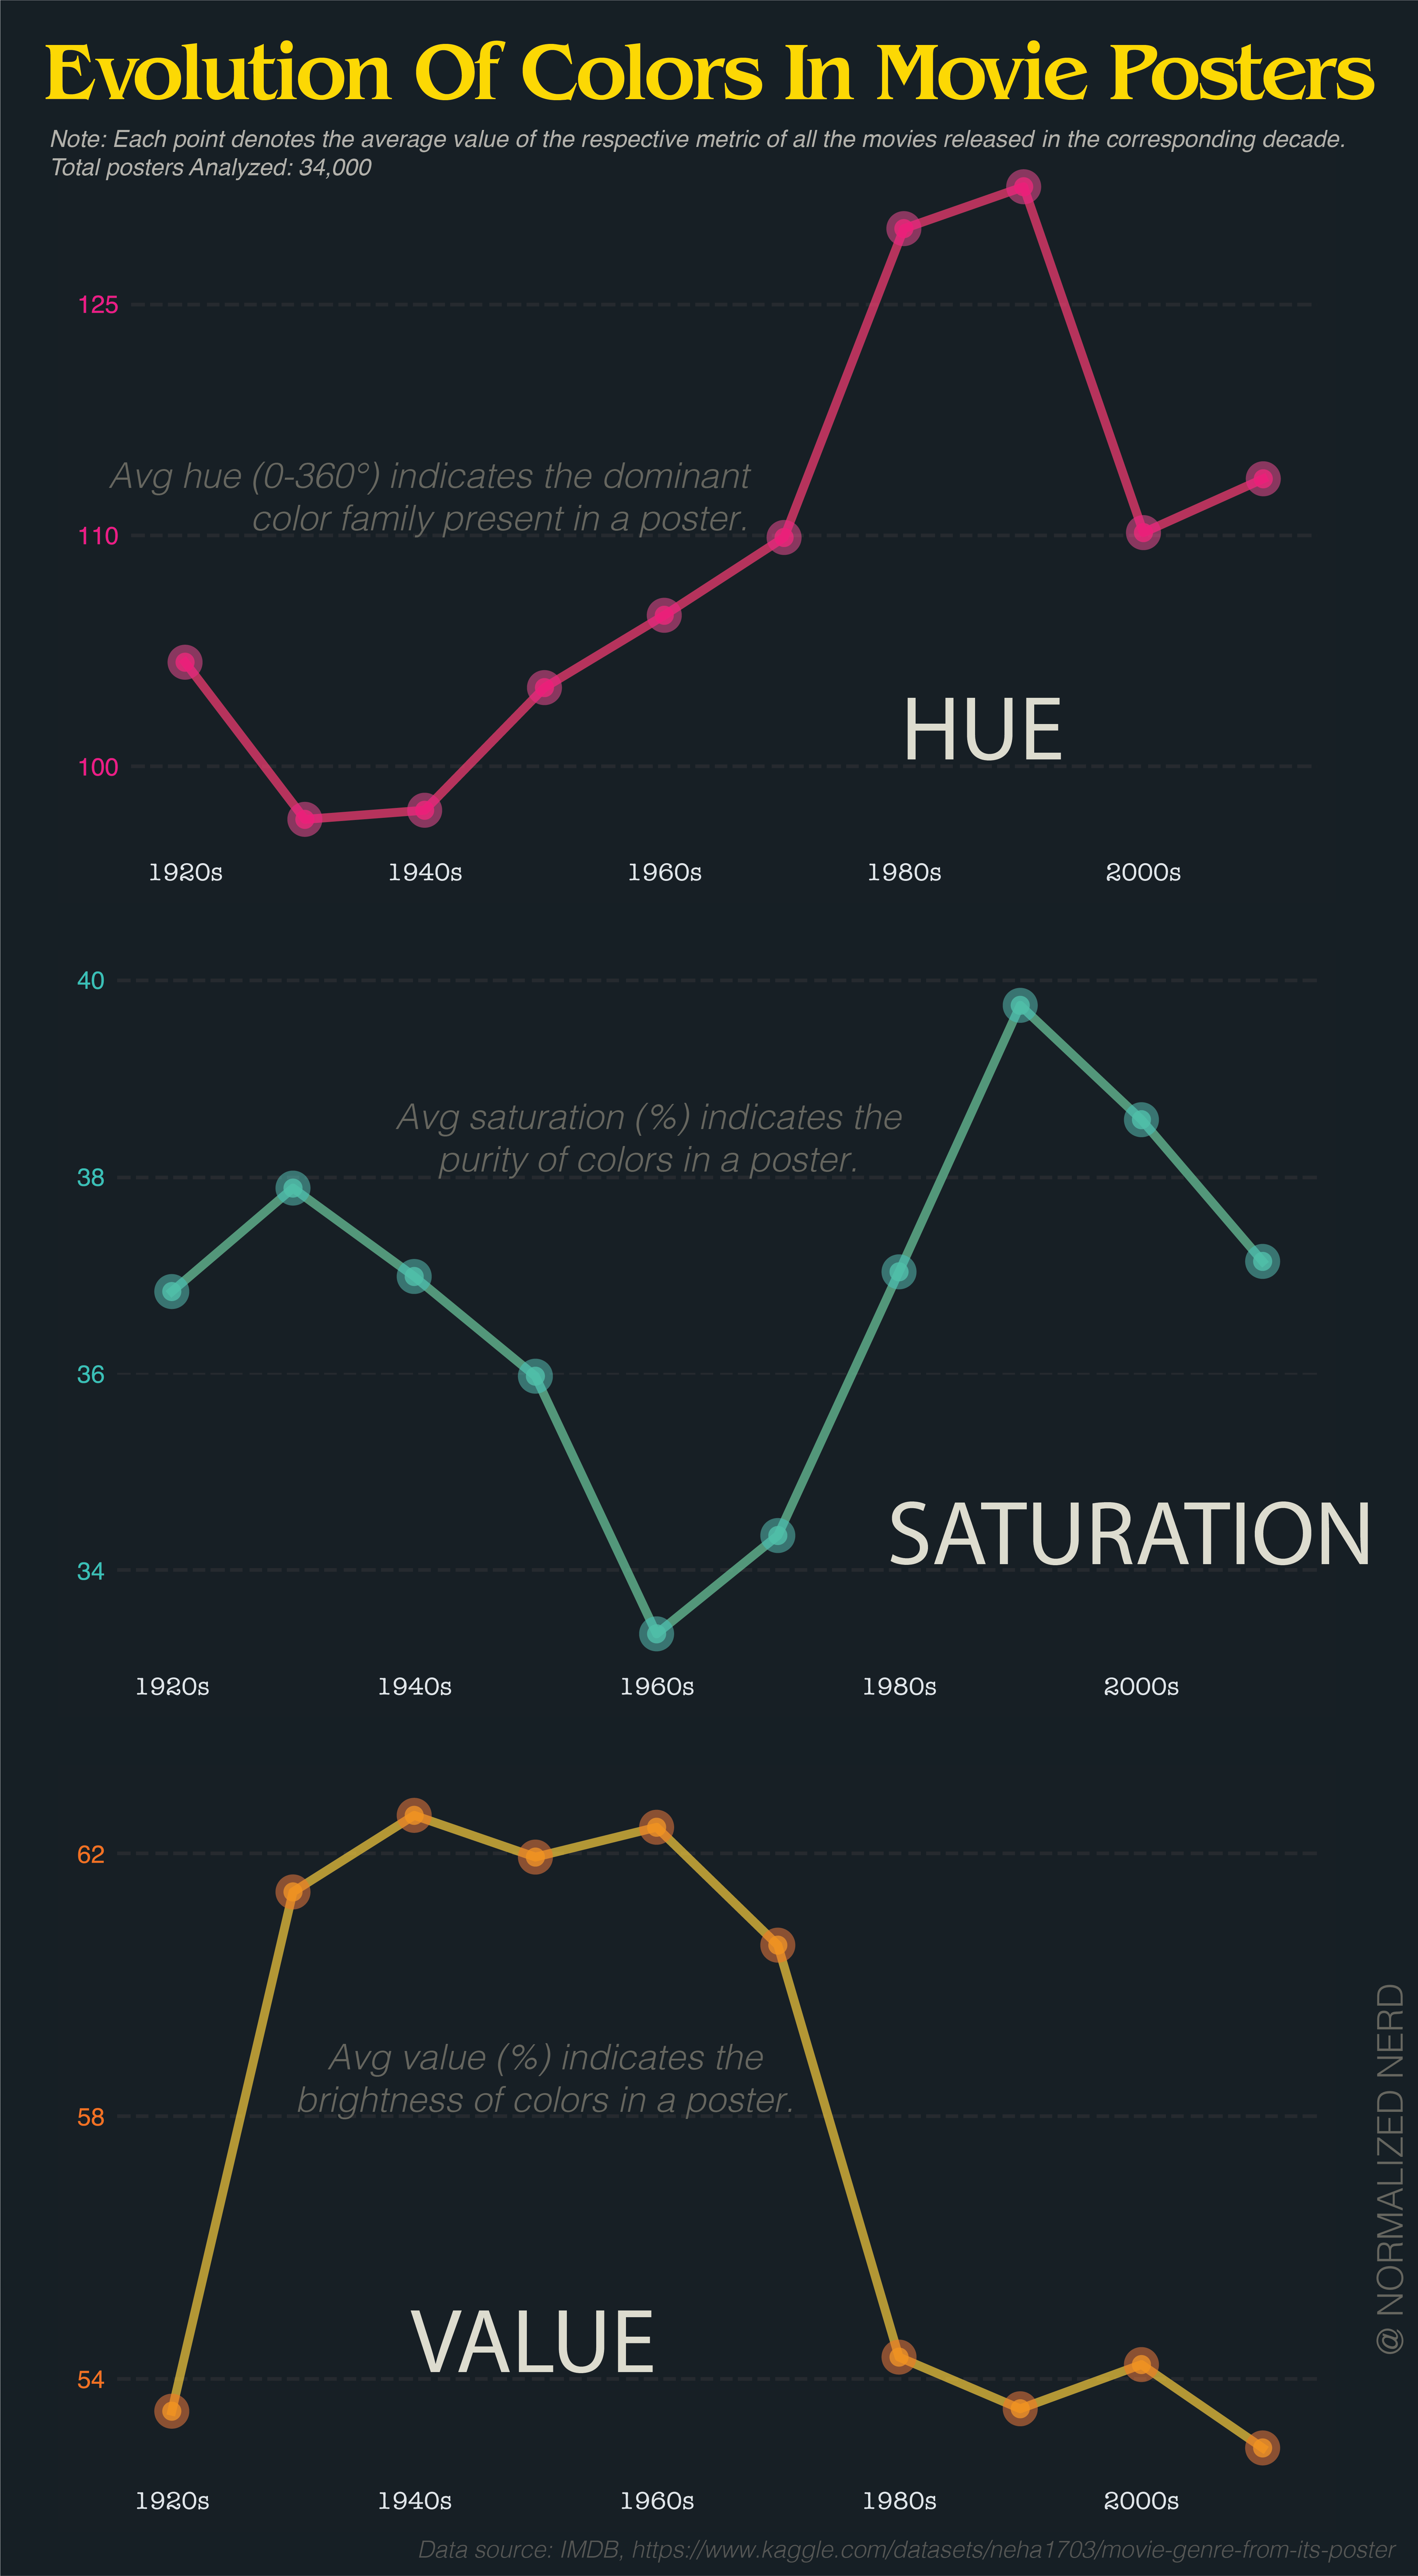
minus-squarebob_lemon ( bob_lemon@feddit.org ) linkfedilinkarrow-up12·2 years agoThe problem is that averaging hue makes no sense at all because hue is not a longest scale. If you take a red poster (0) and a blue poster (240), it averages to green. Or take red (0) and red (359), averaging to cyan (180).
minus-squareflying_sheep ( flying_sheep@lemmy.ml ) linkfedilinkarrow-up4·2 years agoThe average of 0° and 359° is obviously 359.5°. it’s a radial scale.
minus-squarebob_lemon ( bob_lemon@feddit.org ) linkfedilinkarrow-up5·2 years agoBy that logic, the average of red and cyan is both purple and lime. Still useless.
minus-squareflying_sheep ( flying_sheep@lemmy.ml ) linkfedilinkarrow-up1·2 years agoNot if there is a clear trend. If most movie posters are blue, three average will be blue. But i agree, it is useless if there is no clear trend.
minus-squareStarbuncle ( Starbuncle@lemmy.ca ) deleted by creatorlinkfedilinkEnglisharrow-up2·2 years agoI wouldn’t trust someone who tried to visualize hue like this to make that calculation correctly.
minus-squareflying_sheep ( flying_sheep@lemmy.ml ) linkfedilinkarrow-up4·2 years agoYou know what, I completely agree.
minus-squareStarbuncle ( Starbuncle@lemmy.ca ) deleted by creatorlinkfedilinkEnglisharrow-up1·2 years agoIt would have made more sense if they had shown the distribution of hue as a polar graph and just had one every decade to show how it changes over time.


The problem is that averaging hue makes no sense at all because hue is not a longest scale.
If you take a red poster (0) and a blue poster (240), it averages to green. Or take red (0) and red (359), averaging to cyan (180).
The average of 0° and 359° is obviously 359.5°.
it’s a radial scale.
By that logic, the average of red and cyan is both purple and lime. Still useless.
Not if there is a clear trend. If most movie posters are blue, three average will be blue.
But i agree, it is useless if there is no clear trend.
I wouldn’t trust someone who tried to visualize hue like this to make that calculation correctly.
You know what, I completely agree.
It would have made more sense if they had shown the distribution of hue as a polar graph and just had one every decade to show how it changes over time.