
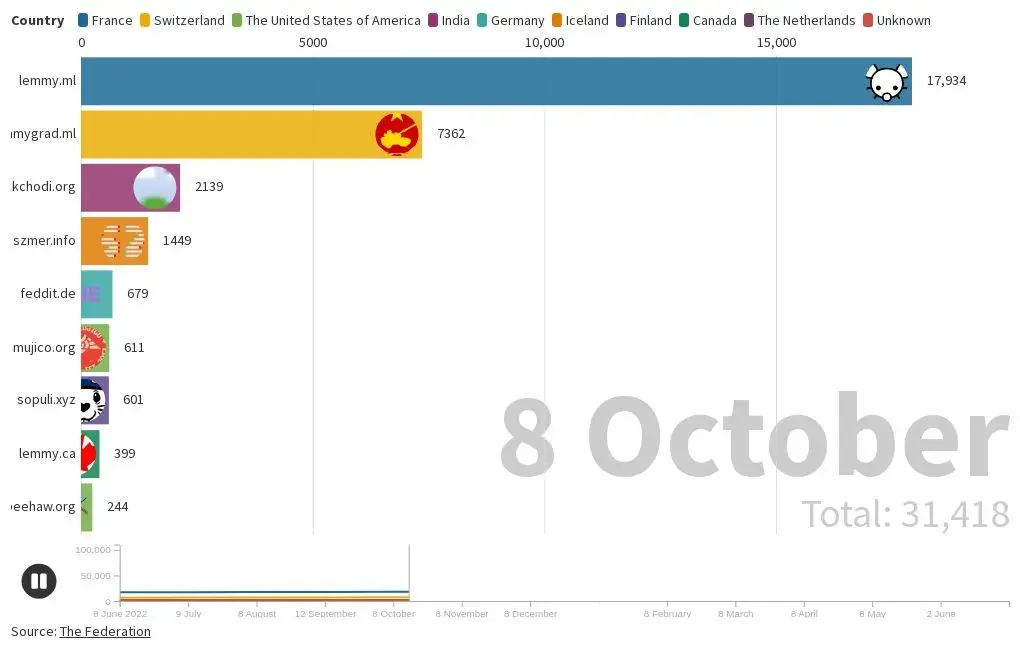
Two timelines I created of the total users at the top 10 Lemmy instances as a bar chart race and as a line chart. The line chart only includes the current top 10 Lemmy instances as of the 9th of June 2023 because Flourish only allows ten lines at a time.
I used the Federation to determine the current top 10 Lemmy instances as of the 9th of June and the 14th of July 2023. The website only has sorting function for the current data, and the instances have to opt in to be included. Therefore, it is likely that some instances are not included. Furthermore, the website seems to only contain data from the last year, so the website do not have documentation on the top instances prior to this period. Additionally, I excluded instances that have had quick growth in total users but not in posts and comments.
deleted by creator
The situation in November with Fosstodon (Mastodon instance) & Twitter might be analogous.
Fosstodon had about 20k users, at the start of November, and more than 50k by the end.
There was definitely an initial surge of activity which diminished after a time, but it didn’t return to it’s previous level.
I don’t have the data but the vibe is that the users to activity ratio stayed about the same, now 6 months on it feels like there’s 250% of the activity that there was at the same time last year.
Of course loads of people are creating accounts here just to have a look but will probably never post, but there’s also plenty of new users who will be engaged long term.